
A trading course coded whole scored PF 1.05, but its horizontal lines alone hit PF 1.63
I translated a discretionary trader's paid Dow-theory course (the Yosuga method) into code and walk-forward tested every piece. The whole method managed PF 1.05, the line-proximity filter and diagonal channels failed, and only quantified horizontal levels survived at PF 1.63 and grew into an adopted sleeve.
I translated a discretionary trader’s paid course into code, rulebook and all. The whole method scored PF 1.05, meaning it earns just 1.05 dollars for every dollar it loses. Nearly break-even. But one by-product of that effort, a way to score how much a horizontal line “matters”, tested out at PF 1.63, beat my core system on quality, and eventually earned a place in my live portfolio.
I have tried to mechanize discretionary trading many times on this blog, and almost every attempt has failed. This is the rare case where a piece of it genuinely worked. This article weaves four studies (research notes 71, 72, 74 and 75) into one story: how a course got dissected, and how the working parts were separated from the ones that only look like they work.
First time here? What you need to know
For new readers: this blog is a verification diary. I (one person) build my own automated FX trading program (an EA), statistically test trading methods, and publish everything, wins and losses alike. “Study N” refers to my numbered research log. Tests run on years of real FX, gold and stock-index data, from 1-minute to daily bars.
Four terms. PF (profit factor) = gross profit over gross loss; above 1 means profitable. DD (drawdown) = the decline from an equity peak, like how far below the summit you have slipped on a mountain hike. Walk-forward testing = fixing the rules on past data, then grading them only on a later, untouched period, so a system cannot pass by memorizing history. A sleeve = one strategy unit inside a larger portfolio system.
The subject is the Yosuga Dow-theory method, a paid PDF course built on one core belief: the only way to win in FX is trend following, and the game is catching the early stage of a trend. As it happens, that is exactly the conclusion I had reached independently through my own testing. Which is why this course, of all courses, seemed worth mechanizing properly.
Coding the core exactly as taught (study 71)
First I translated only the logical core, faithfully. A large ZigZag (a line connecting swing highs and lows) defines Dow-theory trend reversals. When the higher timeframe agrees on direction, a break of the smaller ZigZag’s swing counts as “the pullback after the reversal” and triggers an entry. The stop and the exit are both structural: the trade dies when the trend structure dies.
A telling detail: the course itself quantifies its own anatomy. The logical core is said to account for 62% of the method, trading only near key lines lifts that to 71%, and price action plus scenario selection takes it to 76%. What I coded here is that 62%.
| Metric | Walk-forward result (6 years) |
|---|---|
| Total return | +28.1% |
| Max drawdown | -17.6% |
| PF | 1.05 |
| Profitable years | 3 of 6 |
The +28.1% looks respectable until you open it up. Most of the gain came from 2020 alone, and only 3 of 6 years finished positive, short of my adoption bar of at least 5. The correlation with my existing trend-following core came out at +0.65. In other words, this logic was rediscovering the trend I already trade, not finding a new edge.
None of this means the course is wrong. The core logic does mechanize, and it does stay above water. The problem is that the author’s results clearly do not come from this core. They come from the remaining 38%, the discretionary layers.
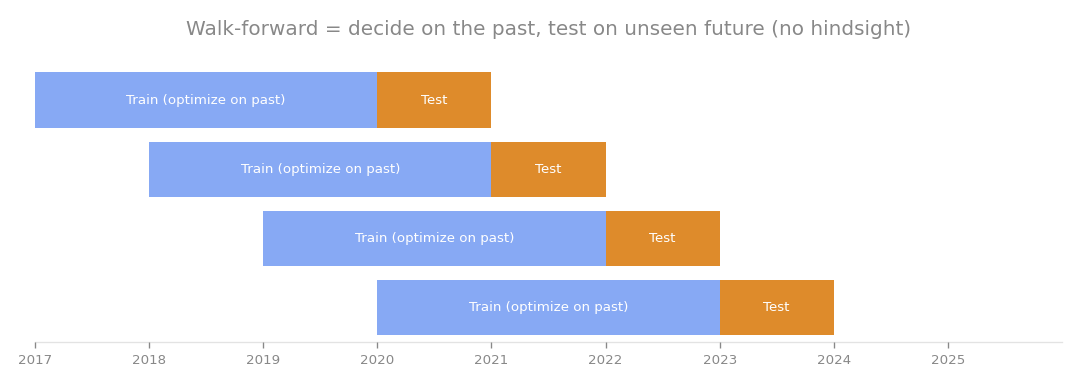
Every verdict in this article is based on data the rules never saw during selection.
Adding “only near key lines” did not close the gap (study 72)
Next, the add-ons. The only add-on the course quantifies concretely is “enter only on trend reversals near prominent highs and lows”. I turned that into a mechanical rule using ATR (average true range, the typical bar-to-bar movement) as the distance yardstick, and compared it against no filter.
| Setting | Walk-forward total | Profitable years (of 6) |
|---|---|---|
| No filter | +26.4% | 3 |
| Line, 1.0 x ATR | +4.2% | 4 |
| Line, 1.5 x ATR | +1.1% | 4 |
In-sample, PF crept from 1.05 to 1.11. Walk-forward, every width shrank the total return, and the losing year 2019 stayed a losing year. The filter reduced trades without adding an ounce of robustness. Measuring “are we near a line?” mechanically simply does not work.
So I closed the question, with a split verdict. The trend-following core is mechanizable and real. But the discretionary surplus, even its one quantified lever, does not convert into an edge that survives walk-forward. Whatever alpha remains lives in context: judging which lines actually matter, reading price action, managing the trade as the scenario unfolds.
The turning point: not “near a line” but “does this line work” (bridging study 73)
Had it ended there, this would be another entry in my long file of “discretion did not mechanize”. But this time there was a sequel, because I changed the question. Not “is price near a line?” but “is this line one the market actually respects?”
Touch counts, bounce strength, a lifecycle rule that retires a level once it gets broken. I built a level engine that scores what a human reads as “this line is being watched”, with strict protection against peeking at future data. With a filter that only allows entries near high-importance horizontal levels, the Yosuga system reached 5 to 6 profitable years out of 6 in walk-forward testing, held up across parameter sweeps, and scored PF 1.63 with a Sharpe ratio (return per unit of risk) of 1.16 on its own. Correlation with my core system dropped to 0.52.
On this blog, “pullback-buying systems evaporate in walk-forward” had been a standing rule. This was the first thing that ever broke it. Distance failed; importance worked. One shift in what you quantify separated the mirage from the real thing.
Bolting it onto the core system raised risk along with return (study 74)
So would this high-quality part improve my confirmed system (Core System v1.1.0 at the time) if I merged it in? That is study 74.
| Metric | Before (v1.1.0) | After (candidate) |
|---|---|---|
| Monthly return | 0.58% | 0.71 to 0.79% |
| PF | 1.39 | 1.45 to 1.47 |
| Sharpe ratio | 0.29 | 0.27 to 0.29 |
| Max DD | - | -10.3 to -11.4% |
| Max-loss failure rate | 1.9% | 3 to 5% |
Monthly return and PF improved. But the Sharpe ratio did not budge, the max drawdown broke through my 10% tolerance, and the max-loss failure rate, the odds of tripping a prop firm’s hard loss limit (a prop firm funds traders who pass its rules), worsened from 1.9% to 3 to 5%. The Monte Carlo pass rate (the probability of passing prop rules, estimated by resampling daily returns) topped out at 91%. With a 0.52 correlation, the merge piled on risk faster than it added diversification.
In short, a trade-off, not an upgrade: a little more monthly return in exchange for a higher chance of disqualification. The confirmed system stayed at v1.1.0 and the merge was rejected.
That looks like a defeat on paper, but the real harvest was elsewhere. The hypothesis that discretion is logic, that a line’s effectiveness can be quantified, and that a low-degree-of-freedom, interpretable indicator can win statistically, was confirmed on real data. The level engine became a permanent part of my testing infrastructure, a bench on which any discretionary concept can now stand trial.
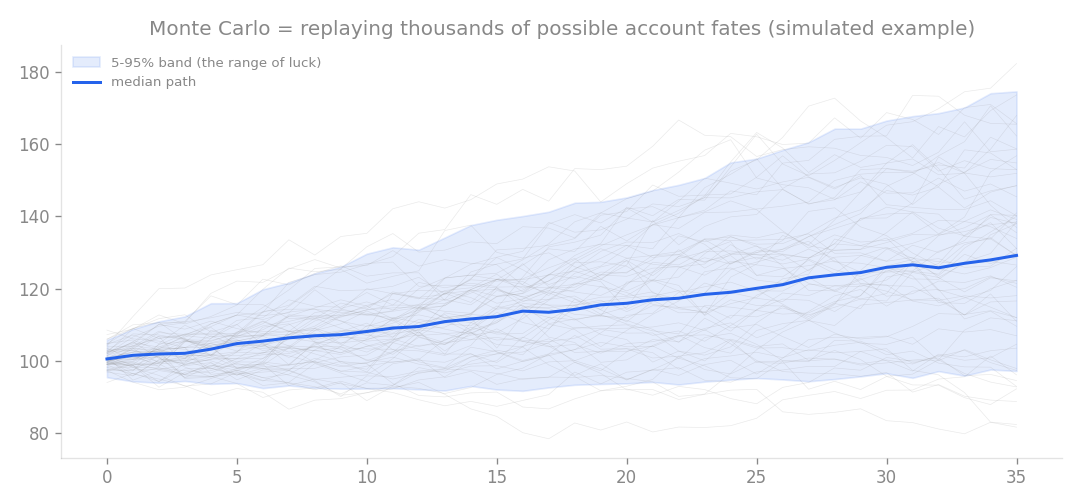
The merge candidate topped out at a 91% Monte Carlo pass rate, below my adoption bar.
Diagonal channels: the data said no (study 75)
One pillar of the course’s line analysis remained: channels, the diagonal lines. I quantified them the same way as the horizontal levels, drawing lines through two recent swings and scoring touches and bounces, with look-ahead bias explicitly ruled out, then ran the same walk-forward gauntlet.
| Setting | Walk-forward total | Years |
|---|---|---|
| Horizontal levels (score 20+) | +42.2% | 5 wins, 1 loss |
| Channels (10+) | -6.8% | 1 win, 5 losses |
| Channels (20+) | +0.3% | 2 wins, 4 losses |
| Levels OR channels | +47.4% | 4 wins, 2 losses |
The horizontal levels reproduced their earlier results. Channels alone sank below zero, and tightening the score to 20+ starved the system down to 54 trades, effectively inactivity. Combining both actually dropped the profitable years from five to four: the low-quality channel entries kept eroding the consistency of the whole. In-sample, channels had flashed PF 1.49 and 2.20. A mirage of selection, nothing more.
The satisfying twist is that the course itself warns that channels are weaker than horizontal lines. The data confirmed the author’s own hierarchy exactly. Channels were rejected, and the testing framework proved it could sort working discretionary elements from non-working ones on evidence rather than faith.
The ledger: which discretion mechanizes, and which does not
The map after four studies (plus the bridging study 73):
- The trend-following core (Dow reversals plus higher-timeframe agreement) mechanizes, but only rediscovers the trend. Alone it is PF 1.05
- Distance from a line does nothing. Importance of a line mechanizes into a real PF 1.63 edge
- Diagonal channels fail even when quantified, matching the course’s own caveat
- Merging into the core system is a trade-off (more return, worse drawdown and failure odds) and was declined
The pattern: the upper layers of discretion, trend direction and recognizing which horizontal levels the market respects, are logic and translate into code. The lower layers, the knack for picking lines, diagonal readings, fine-grained execution judgment, collapse in walk-forward when reduced to simple rules. A discretionary course is neither all real nor all illusion. Decompose it, walk-forward each piece, and you can keep exactly the parts that are true.
One postscript. The rejected merge was not the end of the level-filtered Yosuga system. It was later confirmed as a standalone second satellite system, and today it runs as one of the sleeves in my live portfolio. Not swallowing a course whole, not dismissing it whole, but adopting its verified parts: that seems to me the most honest way to treat a discretionary education.
This article consolidates studies 71, 72, 74 and 75 from my research log.