
A PF 1.03 YouTube strategy became my gold sleeve, but its winning filter didn't transplant
The lineage of TJL, a strategy from a trading video: a coin flip on stocks at PF 1.03, rebuilt into a gold-only sleeve that cleared every portfolio safety check, and the ER/ADX filter that saved it failing completely when moved to my mature gold logic.
The strategy from the video measured out at PF 1.03. That is a coin flip, and normally the story ends right there with a “rejected” stamp. Yet today that same strategy trades gold inside my live system. And there is an epilogue: the filter that rescued it, the one piece that turned a coin flip into a keeper, did absolutely nothing when I transplanted it into my other gold logic.
This article traces that full arc through three studies (research notes 169, 173 and 176): from “useless as shown” to “adopted as a gold-only sleeve”, and then the failed attempt to reuse the winning part elsewhere.
First time here? What you need to know
For new readers: this blog is a verification diary. I (one person) build my own automated FX trading program (an EA), statistically test trading methods, and publish everything, wins and losses alike. “Study N” refers to my numbered research log.
Three terms. PF (profit factor) = gross profit divided by gross loss, above 1 means profitable. DD (drawdown) = the peak-to-trough decline of the account, the “how far downhill” measure. A sleeve is one self-contained trading logic inside my system; the live system runs several sleeves with different personalities side by side.
Study 169: they claimed 54%, I measured 50.8%
The source is a Humbled Trader video presenting TJL (Trend Join Long), a long-only trend strategy for stocks. Their rules, in essence:
- The daily close finishes above the previous day’s high
- Price sits above the SMA200 (the 200-day simple moving average)
- In that context, buy the intraday breakout of the high
Minute data for stocks is hard to source, so I built a daily proxy: previous-day-high breakout with the SMA200 filter, enter at the next open, exit N days later. The test ran on 105 stocks with a 2-cent spread and 0.5% risk per trade. The video’s claim was a win rate around 54%.
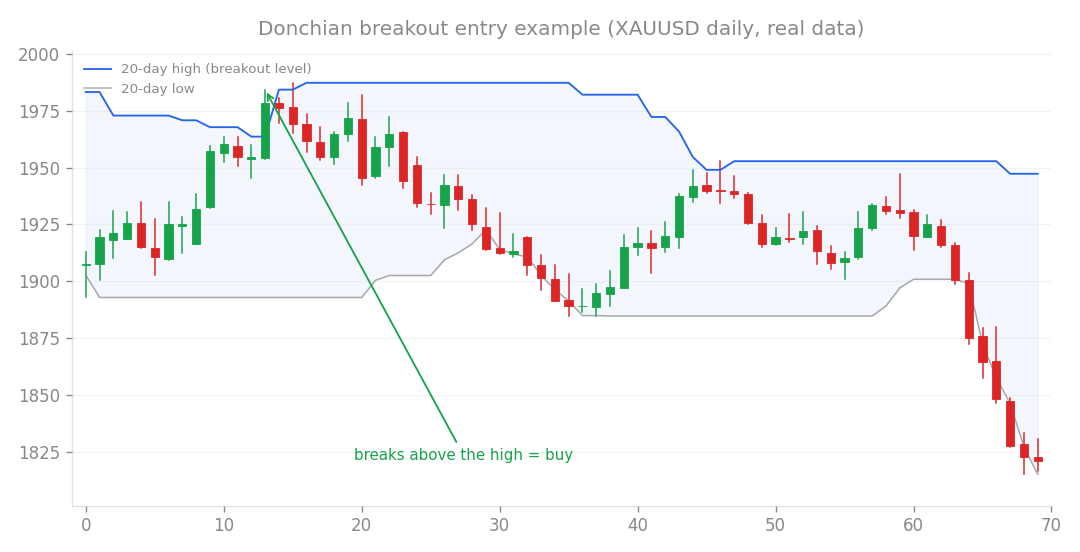
The breakout idea. At its core, TJL is exactly this: buy when yesterday’s high breaks.
One methodological trap surfaced on the way. Feed two years of data into an SMA200 and the first 200 trading days vanish as warm-up, so the test quietly measures only the tail of the window, which happened to be a rally. I fixed it by running the full period once and slicing sub-periods by exit time. Only then did the numbers become trustworthy.
| Variant | Monthly return | PF | Win rate | Max DD |
|---|---|---|---|---|
| Faithful version (exit next day) | +0.48% | 1.03 | 50.8% | -37.8% |
| Hold 5 days | +4.32% | 1.19 | 51.2% | -42.2% |
| Hold 5 days + 2 ATR stop | +2.63% | 1.14 | 50.9% | -22.4% |
| Buy and hold, same stocks | +1.80% | - | - | -12.8% |
The faithful version came out at PF 1.03 with a 50.8% win rate. The claimed 54% did not reproduce; after costs and a broad universe, this is a coin flip. Holding longer lifts the monthly return, but weigh return against drawdown and every variant loses to plain buy and hold. In other words, the strategy just amplifies the market’s beta, the up-and-down of stocks in general, without adding selection skill.
One detail mattered, though. Swap the SMA200 for an SMA50 and the strategy collapses to PF 0.90 with a monthly return of -3.13%. So the trend filter is doing real work; the edge is not zero, merely too thin to survive its costs. Verdict: rejected. But that diagnosis, death by costs, set up everything that followed.
The cause of death was cost, so change the patient (studies 170 to 172)
Instead of discarding the idea, I dug one level deeper. If PF 1.03 means “the per-trade move is too small relative to trading costs”, then the same definition on a market that moves much more, gold, should keep a bigger share of its edge.
That hypothesis paid off. Transplanted to gold, the strategy turned consistently profitable in both halves of the test period (study 170). Adding a double filter, ER (efficiency ratio, how straight the recent price path is) times ADX (a trend-strength gauge), concentrated it on breakouts inside efficient, strong trends and sharpened it further (study 171). It then passed a walk-forward audit (decide rules on past windows, grade them on unseen years) and a portfolio-merge test with the existing system (study 172).
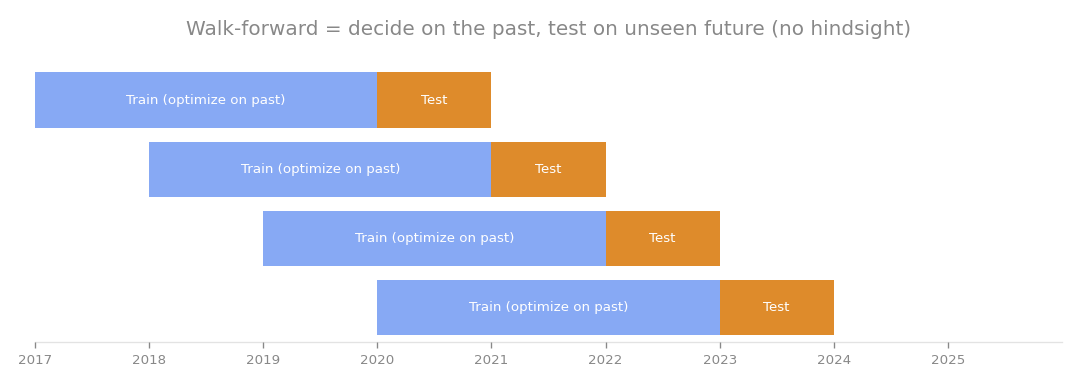
The walk-forward idea. TJL-gold cleared this audit before becoming a candidate sleeve.
The final form: previous-day-high breakout, ER10 at or above 0.3, ADX14 at or above 20, hold for 5 trading days. Those refinement steps have their own articles; here I only need the bridge, because the next question is what a new sleeve does to everything around it.
Study 173: the pre-flight inspection, and every setting stayed put
Adding a sleeve is like adding a new player to a team. Individual stats are not the worry; the worry is everyone losing on the same day. So before implementing, I re-measured the joint intraday risk of the whole seven-sleeve portfolio, TJL included, using the M1 intraday method: rebuild the account’s equity path from 1-minute bars and hunt for the worst single day.
The joint worst day moved from -2.73% to -2.96%, a deterioration of just 0.23 percentage points. And the breakdown was reassuring: the entire slip came from one date, February 25, 2020, when TJL’s loss landed on the COVID crash day. Every other worst-case day actually improved. That is diversification doing its job.
Some context here. My system targets prop firms (companies that let you trade their capital after an audition, under strict daily-loss rules). It carries a safety device called the flat, which closes all positions when intraday losses reach a set line, plus a multiplier k that scales overall risk up or down. At the funded-account setting of k = 1.5, the -2.96% joint worst translates to -4.44%, still inside the -4.5% flat line.
The Monte Carlo simulation (resampling daily returns to replay thousands of possible account fates) told the same story:
| Metric | 6 sleeves | 7 sleeves (+TJL) |
|---|---|---|
| Monthly return | 1.000% | 1.040% |
| Failure rate (with stress) | 4.3% | 3.8% |
| Flat triggers | 0.08/year | 0.08/year |
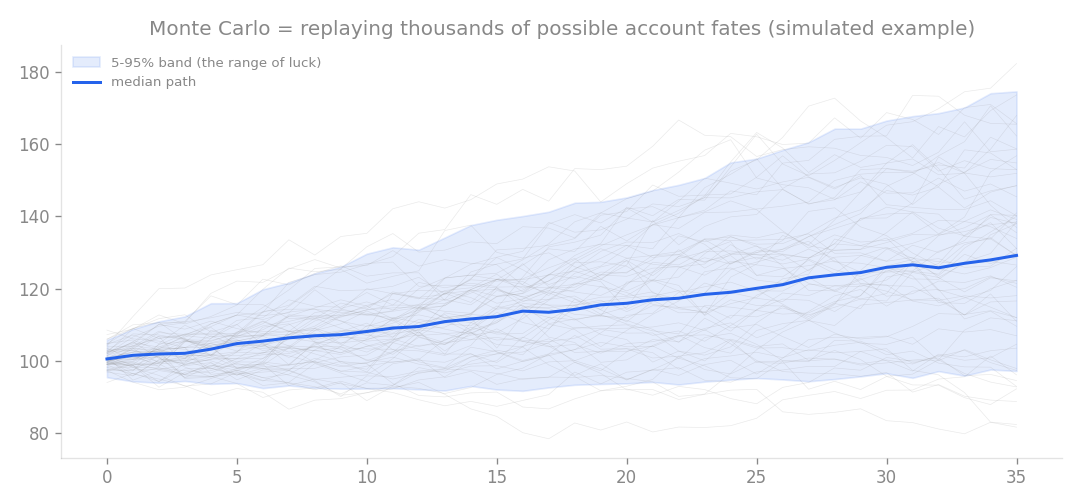
The Monte Carlo idea. Slightly more return, a lower failure rate, and no extra guard activity: the ideal way to welcome a newcomer.
Eleven years of real data agreed. At k = 1.5 the flat never fired, zero days. Even at the aggressive k = 2.5, the number of days touching -5% improved from 9 to 8. TJL alone, measured through the turbulent gold market of May 2026, had a worst intraday loss of -1.72%; scaled by k = 2.5 that is -4.3%, which the -4% flat guard is positioned to catch.
Verdict: every parameter stays exactly as it was. TJL joined as the seventh sleeve at risk 0.005 (0.5% of capital per trade), a 2 ATR stop basis, and dynamic k scaling enabled. No blockers.
Study 176: does the winning filter travel?
Now the epilogue. The hero of this lineage was the ER-times-ADX double filter. So the obvious temptation: my live gold core (the gold ATR candle logic, a long-only blend of H1, H4 and D1 timeframes with an SMA150 filter) trades the same metal. Bolt the same filter on and it should get better too, right?
| Metric | Gold ATR candle, as is | With ER 0.3 + ADX 20 |
|---|---|---|
| Monthly return | +0.42% | +0.24% |
| PF | 1.45 | 1.42 |
| Max DD | -8.4% | -9.4% |
Worse across the board. The monthly return nearly halved and the drawdown deepened. Worse still, the halves of the test disagreed: the first half (treated as OOS, out-of-sample data) improved from PF 1.45 to 1.71, while the second half (IS, the in-sample period) fell from 1.51 to 1.26. A filter that helps in one era and hurts in the next is not robust; it is noise wearing a suit.
For comparison I also tried the filter on a gold BreakoutLong (H1) strategy that is not part of the live core. There the ADX filter alone lifted PF from 1.49 to 1.59, but the monthly return slipped from +0.44% to +0.41%, and since the host logic does not run in production, the result stays a footnote.
The general rule that emerged: the effectiveness of a filter is proportional to the immaturity of the logic underneath. ER and ADX worked on TJL because TJL’s original definition was raw, a single condition of breaking yesterday’s high. A logic that has already been polished has little slack left; stacking conditions on it just trims good trades along with bad ones. My existing gold logic stays unchanged.
What the lineage taught me
- “Useless as shown” is not the end. Pin down the cause of death (here, costs) and you can choose a better host market
- However good a new sleeve looks alone, re-measure the whole portfolio’s worst day before letting it in. Solo stats and joint risk are different animals
- A winning part wins in its context. Whether it transplants is an empirical question, never a logical one
Instead of sorting video strategies into a binary of works or doesn’t, the productive move is dissection: which part is dead, why it died, and where it might live. That dissection turned a PF 1.03 coin flip into a live sleeve. And the same dissection said no, firmly, to the lazy reuse of its winning filter.
This article consolidates studies 169, 173 and 176.