I tested 12 mechanisms to diversify my EA and rejected every one, even at PF 1.81
The full record of hunting for an uncorrelated third sleeve to add to a trend core and Connors mean reversion: shorts, regime rotation, mid-term RSI, 52-week-high momentum, squeeze breakouts and weekly reversion, and the gate where each one died. Why a candidate that passed walk-forward at PF 1.81 still got cut, and the structural conclusion that closed the search.
PF 1.81, a 0.07 correlation to my existing system, and a clean pass through out-of-sample walk-forward testing. A candidate with credentials that good got rejected anyway. So did eleven others. Twelve mechanisms tested, zero adopted.
This article merges six studies (research notes 124, 128, 129, 131, 132, 133) into one story: the hunt for an uncorrelated sleeve to bolt onto my trading system. It is a record of total failure, but the structure that emerged at the end, the reason nothing could be added, turned out to be worth more than any single candidate.
First time here? What you need to know
For new readers: this blog is a verification diary. I (one person) build my own automated FX trading program (an EA), statistically test trading methods, and publish everything, wins and losses alike. “Study N” refers to my numbered research log.
Five terms. A sleeve is one individual strategy inside a portfolio. PF (profit factor) = gross profit divided by gross loss; above 1 means profitable. DD (drawdown) = the peak-to-trough decline in account equity. Correlation measures how similarly two strategies move (+1 identical, 0 unrelated). Walk-forward testing splits data into a rule-selection period (in-sample, IS) and an untouched answer-key period (out-of-sample, OOS), so a strategy is judged on data it never saw. One more will appear later: MC, the Monte Carlo pass rate, which resamples daily returns to estimate the probability of surviving a prop firm’s account rules.
The starting point: both pillars were long
The system at the time (v1.5.0) stood on two pillars. One core strategy rides trends. The other, called Connors, buys short-term dips: when price sits above the 200-day moving average and the 2-period RSI sinks below 10, it buys the panic and sells the bounce. Both are long-only, and both do their best work in rising markets.
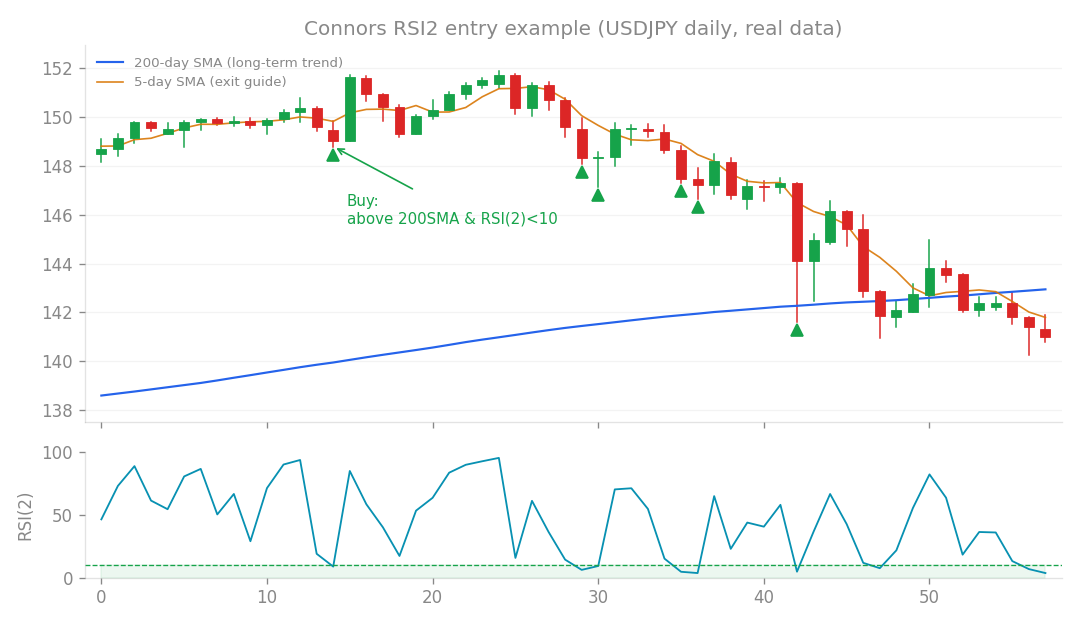
One of the two pillars, the Connors RSI2 dip-buy. Many candidates in this story die for behaving exactly like it.
So what happens when the market falls or goes sideways? That was the hole. A third sleeve that makes money while the core is underwater would smooth the drawdown curve considerably. Finding that uncorrelated sleeve is the whole plot of what follows.
Study 124: shorts and Bollinger reversion, the first blanks
The obvious candidates came first. If the hole is falling markets, try shorting. If dip-buying works, try a Bollinger Band (BB) reversion cousin.
| Candidate | Monthly | PF | Why it died |
|---|---|---|---|
| BB reversion long | +0.14% | 1.63 | +0.45 correlation to Connors, redundant |
| Connors short | +0.09% | 1.26 | Collapsed in walk-forward to PF 0.87, -0.04% monthly |
The BB reversion had decent numbers and a mere +0.03 correlation to the core, but a +0.45 correlation to Connors. It was buying the same dips with a different ruler. No real diversification.
The Connors short (selling bounces in falling markets) looked ideal on the full period: PF 1.26, +0.09% monthly, -0.13 correlation to the core. Then came the split: select on 2015-2020, verify on unseen 2020-2025. The result fell apart to PF 0.87, -0.04% monthly, Sharpe -0.29. The full-period appeal was selection bias, a fit to the past. It also reconfirmed an old lesson of mine: shorting this market has been a drag, not a hedge.
Study 128: rotating by regime had no basis at all
Next, a change of angle. Instead of adding a strategy, what about switching between the two I already have? Shift capital toward the trend core when the market trends, toward Connors when it ranges. Surely that beats a fixed allocation.
The plan was to judge the regime with ADX, a standard trend-strength indicator. The data said no before the idea even got started: the correlation between ADX and which strategy wins came out at -0.035. Essentially zero, and not even monotonic across quantiles. The regime does not predict the winner.
Digging into why made it obvious. Connors earns during uptrends too, by catching the small dips inside them, and the core’s breakouts fire inside ranges. The two edges never separate cleanly by regime, so a fixed allocation was already harvesting both. Rotation would only add timing risk. Rejected.
Study 129: the same reversion on a slower clock found nothing
If Connors works on a 2-period RSI, maybe a 14-period RSI would catch a different, slower rhythm and become a second reversion sleeve. A natural idea with a blunt result: across every symbol tested, not one produced a PF above 1.05. No edge exists there.
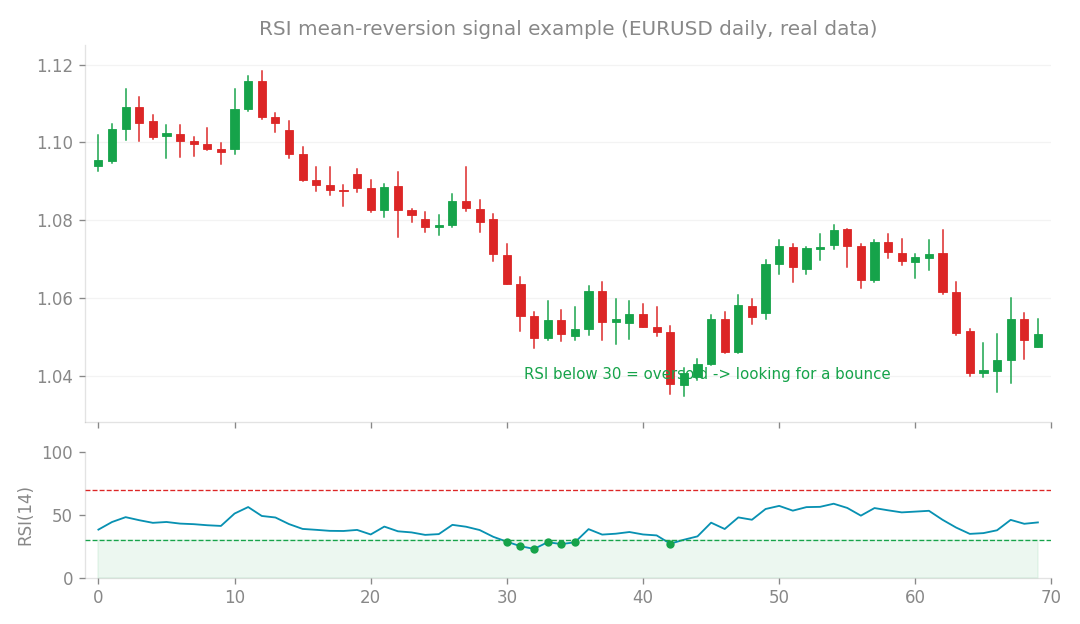
The RSI reversion concept. Stretching the lookback from 2 to 14 made the edge vanish entirely.
The insight matters more than the failure. Mean reversion seems to be a phenomenon of extreme short-term overreaction: two days of violent selling overshoot, then snap back. A gradual slide of the kind RSI(14) flags is not an overshoot, it is a trend in progress, and it keeps going down. In other words, Connors was already sitting on the only mean-reversion spring in this ground.
Study 131: adding genuine momentum nearly doubled the drawdown
From here the search went to batch mode. Batch one held four mechanisms.
| Mechanism | Key numbers | Why it died |
|---|---|---|
| Consecutive down-bar reversion | PF 1.28 | 0.73 correlation to Connors, redundant |
| 52-week-high momentum | PF 1.58 (OOS PF 1.33) | Combined DD worsened from -9.4% to -16.7% |
| Oversized down-bar reversal | Edge on 0 symbols | No edge |
| Weekly Donchian breakout | Only 2 symbols qualified | Too few opportunities |
The heartbreaker was 52-week-high momentum, which buys the push to fresh yearly highs. Standalone PF 1.58, and it passed walk-forward with an OOS PF of 1.33 and Sharpe 0.38. By the numbers, real momentum.
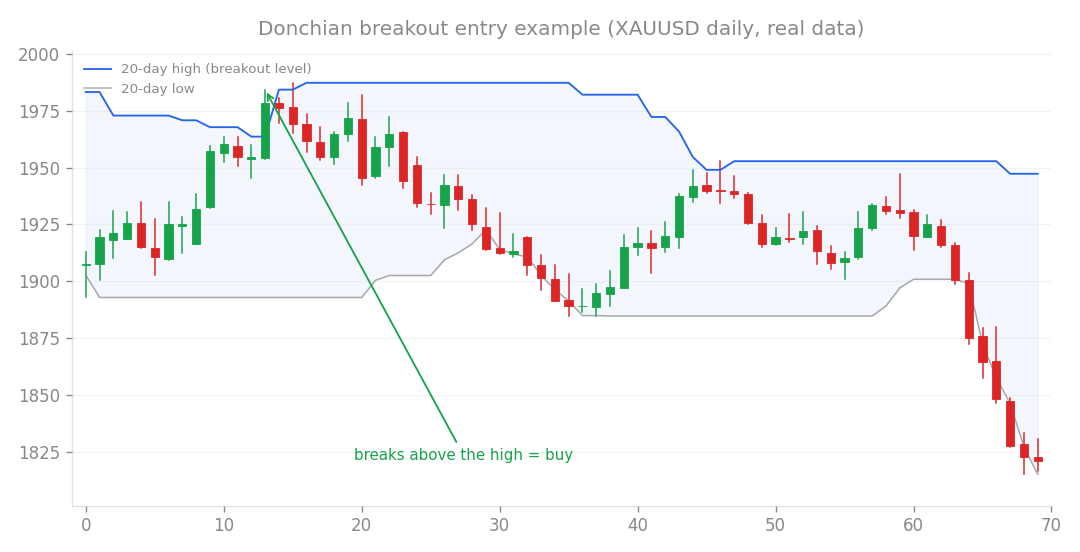
Buying strength at new highs. Excellent alone, but it was climbing the same mountain as my existing trend core.
Run alongside v1.5.0, though, the maximum DD deepened from -9.4% to -16.7%, the MC pass rate dropped from 96% to 85%, and the DD-normalized monthly return (scaled to a 10% drawdown) fell from 0.99% to 0.63%. The 0.43 correlation to the core told the story: this was trend rediscovery. I was not diversifying, I was stacking more risk onto the same market phase, like a climbing party bunching onto one route so that a single rockfall takes everyone. A strategy that is excellent alone and harmful when added: I would see that shape again.
Study 132: PF 1.81, uncorrelated, walk-forward passed. Still cut
Batch two is the climax of this story.
| Mechanism | PF | Sharpe | Correlation | Verdict |
|---|---|---|---|---|
| VWAP-stretch reversion | 1.63 | 0.96 | 0.52 to Connors | Redundant, rejected |
| Low-close reversion | 1.35 | 1.39 | 0.55 to Connors | Redundant, rejected |
| BB squeeze breakout | 1.81 | - | 0.07 core / 0.13 Connors | Worsened the blend, rejected |
The two reversion entries repeated the now-familiar pattern, correlations to Connors above 0.5. No surprise left there. The third one is the candidate from this article’s opening line. The BB squeeze breakout waits for volatility to compress, then trades the expansion. PF 1.81. Correlation of 0.07 to the core and 0.13 to Connors, nearly independent of both. It even passed walk-forward with an OOS PF of 1.36 across 71 trades.
And yet, blended with v1.5.0, the maximum DD worsened from -9.4% to -13.3%, and the DD-normalized monthly return fell from 0.99% to 0.74%. How does something that uncorrelated make the portfolio worse?
That question produced the most valuable sentence of the whole search: low daily correlation is not the same thing as diversified drawdown. The squeeze breakout is still, at heart, a trend-long strategy. Its day-to-day wiggles differ from the core’s, but its bad days arrive on the same calendar, the days when a trend reverses or a risk-off shock hits everything at once. Uncorrelated in fair weather, synchronized in the storm.
For a sleeve to be genuinely additive, it must earn while the core is losing. Its drawdowns must run inverted, not merely unaligned. The only class of strategy that does that here is short-term mean reversion, and that seat was already taken by Connors.
Study 133: the weekly version died too, and the search closed
The final batch tried mean reversion on weekly bars (a 3-period RSI on W1). Positive edge on zero symbols. Weekly bars offer too few trades, and as study 129 showed, the reversion edge lives only in violent short-term overshoots. Stretching the clock was never going to work.
Time to settle the account. Across studies 124 through 133 I had tested 12 distinct mechanisms: shorts, Bollinger reversion, regime rotation, mid-term RSI, 52-week-high momentum, squeeze breakouts, weekly reversion and more. Every single one was rejected.
Every failure fell into one of four graves
Line up the causes of death and only four patterns exist.
| Failure mode | What it means | Examples |
|---|---|---|
| Trend rediscovery | Drawdowns synchronize with the core, nothing is added | 52-week momentum, squeeze breakout |
| Redundant with Connors | The same dips bought with a different ruler | BB reversion, VWAP stretch, low-close |
| No edge | No statistical advantage exists at all | RSI(14), oversized down-bar, weekly reversion |
| Cost death | Thin margins eaten by transaction costs | The high-turnover candidates |
Price offers two broad sources of return, trends and short-term reversals, and my system already taps both. So every new mechanism gets pulled into one of the four graves above. That is the structural anatomy of a twelve-loss streak.
Pushing further down this road, brute-forcing ever more mechanical rules, mostly raises the odds of data dredging: mistaking a lucky fit for a real signal. I will not call it a ceiling, but the verdict at that point was clear. This particular search closes here, and the next improvement has to come from new data or a different asset class.
What a total wipeout paid out
Was it worth nothing? I don’t think so. First, twelve dead candidates are the proof of how rare the Connors sleeve actually is. I searched the space thoroughly, and the only genuine non-trend addition it contained was the one already running.
Second, the audit standard itself got upgraded. The first question for any new candidate is no longer “is the daily correlation low?” but “does it earn on the days the core bleeds?” However handsome the standalone numbers, the blended drawdown is the answer sheet. Cutting that PF 1.81 candidate still looks like the right call from here.
This article is a consolidation of studies 124, 128, 129, 131, 132 and 133.