
The long-only trend strategy I had written off came back at +52.6% in forward testing
Seven studies from the scan era: regime switching, cross-sectional momentum and an 80-combination full scan all failed, the data got cleaned, weak edges got stacked, and the story ended with a correction. Long-only trend following was the one real edge.
“Standard technical indicators hold no exploitable edge in FX price data.” I wrote that conclusion in my own research log. Then I had to retract it. One approach, long-only trend following (buying only, never shorting), turned out to be genuine, posting +52.6% total in forward testing. The thing hiding it had never been the market. It was my own test design.
This article stitches seven studies from my research log (studies 13, 14, 15, 19, 20, 23 and 25) into one story: the turning-point era where I scanned the standard technical toolbox, rejected it piece by piece, stepped on a data trap, tried bundling weak edges, and finally arrived at a correction. Every losing number stays in.
First time here? What you need to know
For new readers: this blog is a verification diary. I (one person) build my own automated FX trading program (an EA), statistically test trading methods, and publish everything, wins and losses alike. “Study N” refers to my numbered research log. The goal is an EA that can pass a prop firm’s evaluation (a firm that lets you trade their capital and share the profit) and keep withdrawing.
Four terms up front. PF (profit factor) is gross profit divided by gross loss; above 1 means profitable. IS/OOS means splitting data into a rule-selection period (In-Sample) and an untouched answer-key period (Out-Of-Sample). Walk-forward (forward testing) repeats that split through time: pick rules using only the past, then test them on a period the rules have never seen, so nothing is decided in hindsight. DD is drawdown, the decline from an equity peak.
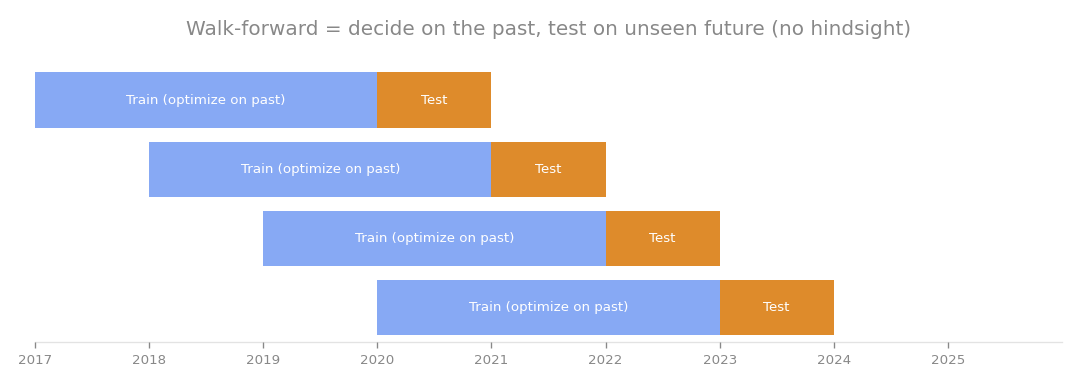
The walk-forward idea, used in every study below. In the second half of this story, it becomes the judge that separates the real edge from hindsight.
Study 13: switching strategies by market regime
The starting point was an idea most traders entertain at some point. Markets alternate between trending phases and ranging phases, so why not measure trend strength with ADX (a standard trend-strength indicator), follow the trend when it is strong, and fade moves when it is not? Best of both worlds, in theory.
Walk-forward said otherwise:
| Timeframe | Total return | Winning years |
|---|---|---|
| Daily (D1) | -9.5% | 3 of 7 |
| 4-hour (H4) | -29.4% | 2 of 7 |
Both timeframes lost money. The lesson was blunt: combining components that have no edge does not create an edge. Trend following alone had failed, mean reversion alone had failed, and bolting a switch between them changed nothing.
At this point the standard technical repertoire (trend, mean reversion, hybrids) was essentially exhausted. One respectable price-based hypothesis remained: cross-sectional momentum, the relative strength between currencies.
Study 14: the last card, and a conclusion I would later regret
Cross-sectional momentum buys the strongest currencies and sells the weakest. It rests on a different mechanism than indicator triggers and has academic backing in FX, so I treated it as the final price-based test.
It sank completely. With a fixed lookback over the full history, every variant lost between -11% and -40%. Walk-forward came in at -8.6% total. The autopsy pointed at the yen: JPY pairs, even viewed through relative strength, revert to their old levels more than they extend, which is poison for a momentum strategy.
So I wrote a verdict in the log: with this price data and standard technical indicators, no edge robust enough for consistent prop-firm withdrawals exists, and further variant-hunting would just be data dredging. Looking back, that verdict was half right and half wrong.
Study 15: I had been diluting my own results
The turn came from doubting my own setup. Until then I had been pooling six JPY pairs into one test. Pooling averages everything, so a sharp edge that lives in one specific market gets watered down by the mediocrity of the others.
I changed course and ran a full scan: 20 currency pairs times 4 strategies on daily bars, all walk-forward. Viewed individually, candidates surfaced:
| Pair and strategy | Total OOS | Winning years | Avg annual |
|---|---|---|---|
| XAUUSD (gold) x Donchian | +21.8% | 5 of 7 | +3.1% |
| AUDJPY x Donchian | +12.6% | 5 of 7 | - |
| GBPNZD x RSI | +9.4% | 6 of 7 | - |
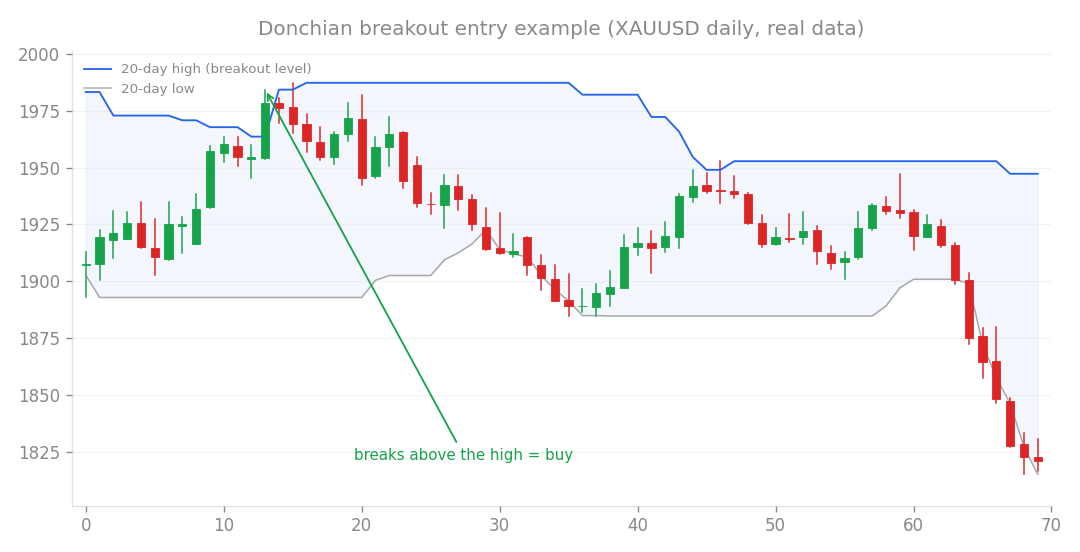
The Donchian channel idea: buy when price clears the recent high, riding the breakout.
The headliner was gold with a Donchian channel. Gold is a classic trending market, so the statistics and the fundamental story agreed. But a warning label belonged on the box: run 80 combinations and roughly a 22% chance exists that some strategy wins 5 of 7 years by pure luck. That is the multiple testing problem. Survivors were candidates only, to be filtered on three criteria: statistical consistency, a fundamental rationale, and parameter robustness.
Study 19: cleaning the data shrank the gold edge to a quarter
During that filtering, a data-quality problem surfaced. The most recent gold price history (2026) contained anomalies that had been inflating results. I built a cleaning layer into the test framework to detect and remove broken bars, then re-ran everything on clean data.
Gold x Donchian collapsed from +21.8% to +5.3% total, about 0.8% a year. Most of the shine had been the strategy riding a data artifact. The clean-data leaderboard looked like this:
| Pair and strategy | Total | Winning years |
|---|---|---|
| USDJPY x Trend+ADX | +10.5% | 6 of 7 |
| EURJPY x RSI | +9.2% | 5 of 7 |
| GBPNZD x RSI | +8.7% | 6 of 7 |
All of them sit around +1% to +1.6% a year. As the top picks out of 80 tries, they may well be nothing but survivor luck, and they are nowhere near the +8% profit target a prop evaluation demands. The one real asset left standing was the framework itself: a multi-stage sieve that catches fake edges, data problems included.
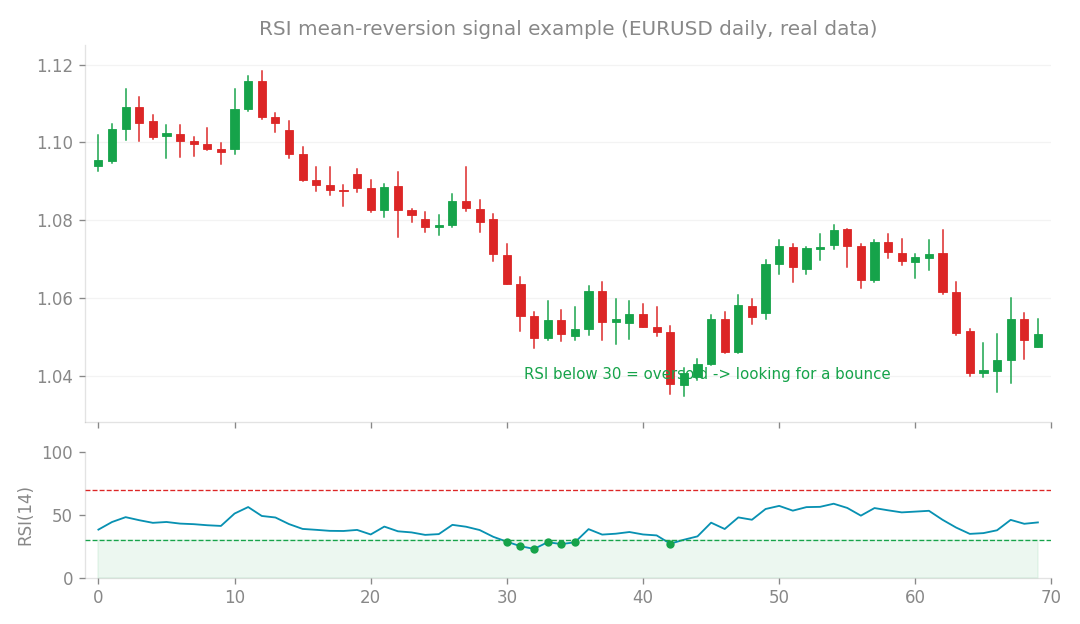
RSI mean reversion, a recurring face in the scan leaderboards: buying the bounce out of oversold territory.
Study 20: stacking weak edges looked great on paper
If no single strong edge exists, why not bundle weak ones? I built a six-component portfolio: trend-following with ADX on USDJPY and EURAUD, RSI mean reversion on EURJPY, GBPNZD, GBPUSD and XAGUSD (silver), each at 0.5% risk per trade. Average daily correlation between components: 0.00, effectively uncorrelated.
On clean data from 2016 to 2024:
| Metric | Result |
|---|---|
| Total return | +17.7% (roughly 2% a year) |
| Max drawdown | -6.3% |
| PF | 1.27 |
| Sharpe ratio | 0.69 |
| Winning years | 6 of 7 |
Nothing flashy, but the shallow drawdown was attractive, with comfortable margin under the -10% loss limits typical of prop firms. The structural point, that bundling uncorrelated components suppresses drawdown, I still consider real.
The worry I had flagged myself, though, came true later. This portfolio was assembled by picking the pairs and methods that had won in the past. When the entire construction, selection included, went through a full forward test on unseen data, the performance did not survive. It had been hindsight in a portfolio’s clothing. Diversification can flatten the equity curve, but without a persistent positive expectancy there is nothing to flatten. Back to square one.
Study 23: correction, long-only trend following was real
Here is the climax of the era. A separate research track I run in parallel had a long-only strategy that actually worked in practice. Borrowing its design, I implemented a buy-only breakout strategy on H1 (1-hour bars): a Donchian channel entry filtered by a 150-period simple moving average. Then I put it through the harshest yardstick I had, the same full forward test (configuration selection also out-of-sample) that had just sunk study 20.
| Item | Result |
|---|---|
| Total return | +52.6% |
| Winning years | 4 of 6 (2020 +10.9%, 2022 +19.8%, 2023 +9.0%, 2024 +22.1%) |
| Losing years | 2 (both -4.6%) |
The selected pairs converged on XAUUSD, USDJPY, GBPJPY, EURJPY and CHFJPY. Gold and yen crosses, in other words markets with a pronounced long-term drift.
Two things follow. First, my tools work: a known real edge was reproduced under forward testing, which is exactly what a healthy test rig should do. Second, and this is the point, long-only trend following is a genuine edge.
So why had I concluded “no edge” before? The market had not changed; my test design had been hiding the answer, in three specific ways. I forced symmetry, trading long and short alike, which cancels out the upward drift these assets carry. I used no trend filter. And I pooled currencies, diluting the markets where the effect lives with the markets where it does not. A negative conclusion can be flat wrong if the test that produced it was too narrow. That correction reshaped how I treat every “nothing found” result since.
Study 25: hunting a second pillar, and losing every candidate
Once you own one real edge, you want a second, uncorrelated one. Two pillars support each other through rough patches and cut drawdown. I tested the full slate of candidates:
| Strategy | OOS | IS |
|---|---|---|
| A: M30 opening range breakout | -96% | -94% |
| B: H1 range fading (USD pairs) | -8.9% | -10.4% (PF 0.94) |
| C: H1 trend short sleeve | +8.0% | -48.5% |
Candidate A traded so frequently that spreads (transaction costs) devoured it whole. Candidate B was genuinely uncorrelated with the trend core (-0.07) and did smooth the combined drawdown, but with a negative standalone expectancy it merely loses money somewhere else. Candidate C, the short-only trend sleeve, showed +8.0% out-of-sample but had collapsed -48.5% in-sample during rising markets, which is not a strategy you can trust.
The verdict was clean: in FX price data, the one real edge is long-only trend following, full stop. True diversification would have to come from outside price, such as interest-rate differentials (carry), which matched the independent conclusion of that separate research track. The best move was therefore not a second pillar but maximizing the first: an equity overlay that halves lot sizes whenever account equity dips below its 60-day moving average, cutting drawdown and freeing room to re-leverage. On the separate track, that overlay had already doubled the monthly return.
What the era left behind
The final ledger of the seven studies:
| Study | What was tested | Outcome |
|---|---|---|
| 13 | Regime switching (trend x mean reversion) | Rejected (D1 -9.5%, H4 -29.4%) |
| 14 | Cross-sectional momentum | Rejected (walk-forward -8.6%) |
| 15 | Full scan, 20 pairs x 4 strategies | Candidates found, multiple-testing suspicion |
| 19 | Clean-data re-scan | Gold +21.8% to +5.3%; leaders within luck’s reach |
| 20 | Six uncorrelated weak edges bundled | PF 1.27, later exposed as hindsight |
| 23 | Long-only trend following | Real (+52.6% forward). Conclusion corrected |
| 25 | Every second-edge candidate | All rejected. Maximize the first pillar |
Three lessons distilled. One: components without an edge cannot be combined into an edge, whether you switch between them or stack them. Two: the market is not the only adversary; broken data and multiple testing will keep showing you convincing fakes. Three, the one I value most: even the conclusion “there is no edge” can be wrong if the test design is narrow. Forced long-short symmetry, pooled markets and missing filters were precisely the design choices that buried a real edge.
Which is why I no longer declare “I have tested everything, nothing exists.” In later work, this long-only trend core grew into a multi-sleeve system, but its foundation was poured here, in the scan era. At the bottom of a mountain of rejections, one correction was waiting. That is the story of these seven studies.
This article consolidates studies 13, 14, 15, 19, 20, 23 and 25.