
I tested three roads to bigger returns. The winner was a 70,000-yen reserve
More gold, an easier account plan, or parallel accounts: three roads to scaling returns, measured all the way down to ruin probability across four studies. Two roads vetoed by tails and rules; the survivor's fate hinged on how you spend one entry fee. Full distribution shapes included.
One conclusion in this project is immovable: the edge will not grow. The information inside price has been searched to exhaustion, and leverage saturates near 2.1% monthly. If the earnings are to grow anyway, the only lever left is capital.
Three candidate roads: tilt harder into gold, which keeps winning; switch to the prop firm’s newly announced easier plan; or multiply the accounts themselves. Four studies (research notes 221, 224, 231, 243) measured all three against the harshest yardstick available, ruin probability. One road survived, and its fate came down to how you spend 70,000 yen.
First time here? The premise
For new readers: this blog is a verification diary. I (one person) build my own automated FX trading program (an EA) and publish every test, wins and losses alike. “Study N” refers to my numbered research log.
Two prerequisites. First, my EA trades a prop firm account: pass an evaluation and you trade company capital (about seventy thousand dollars) keeping 80% of profits, but a -5% daily or -10% total loss disqualifies you instantly. The entry fee is 69,800 yen (about $450). Second, the system blends eight sub-strategies (sleeves): FX trend following, mean reversion, indices, gold, with a verified baseline of PF 1.69 (gross profit over gross loss) and +1.06% monthly.
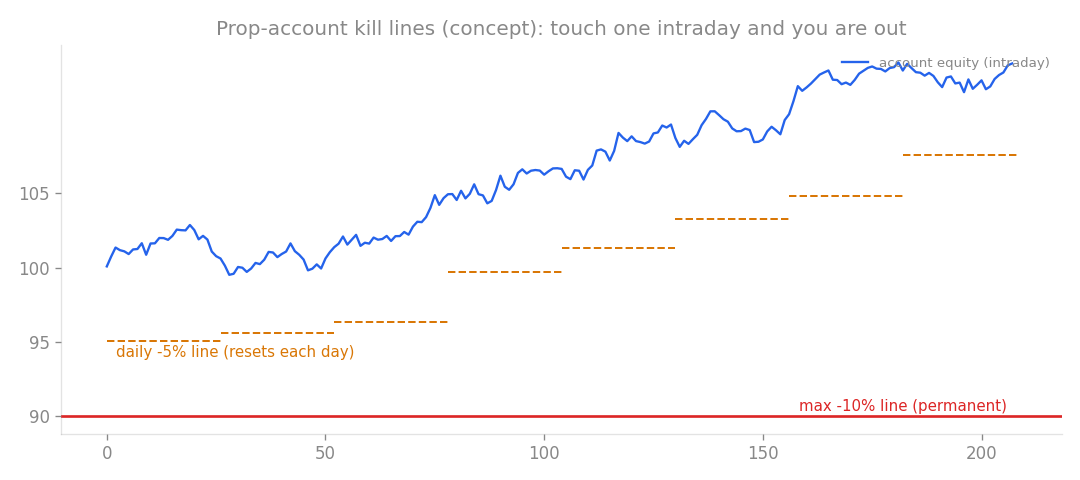
“Ruin” in this article means touching these lines and losing the account. All three roads are judged against that probability.
Road 1: more gold (studies 221, 224)
Start with the most natural idea. My EA’s gold sleeves have been on a run for years. Sweeping only the gold risk from 0x to 2x in the deployed configuration:
| Gold multiplier | OOS monthly | PF | OOS max DD |
|---|---|---|---|
| 0 (no gold) | +1.342% | 2.21 | -3.5% |
| 1.0 (current) | +1.409% | 2.08 | -3.6% |
| 2.0 | +1.513% | 1.97 | -3.8% |
Out-of-sample returns climb monotonically, drawdowns barely move. Looking at the table alone, why not double it? For a moment I thought so too.
Three warning lights said otherwise. First, the selection period (2015-23) peaked at 1.5x and declined at 2x; only the unseen period (2023-26) improves cleanly, and gold spent exactly those years in a strong bull run. The sweep is most likely harvesting that realized trend, not a structural property. Second, PF degrades steadily from 2.21 to 1.97: the marginal trades are worse trades. Third, single-asset concentration risk never shows up in realized drawdown numbers.
So the tail got measured directly: block-bootstrap each configuration’s daily returns, run 12,000 three-year compounding Monte Carlo paths, (Monte Carlo means reshuffling the daily results into thousands of alternative fates)
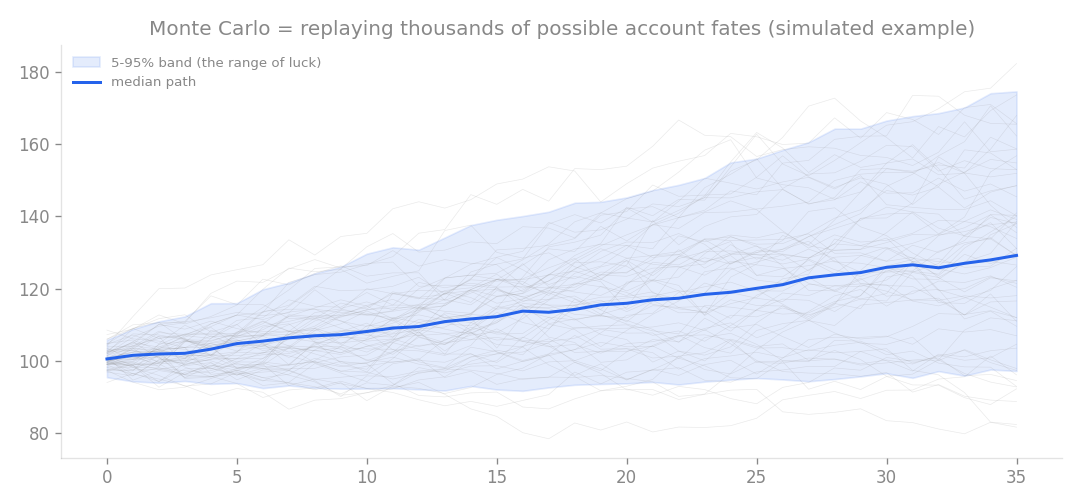
Not one backtest curve but the whole range of luck: that is the article’s standard of comparison. lever every variant to the same 4% median monthly return, and compare only the bad side. An equal-exchange question: at identical returns, whose tail is safer?
| Gold multiplier | 95th-pct max DD | P(losing half the account) |
|---|---|---|
| 1.0 (uniform) | 40.0% | 0.8% |
| 2.0 | +0.5pt | +0.2pt |
| 3.0 | +3.7pt | 1.7% (doubled) |
The answer was crisp. Up to 2x the tail is neutral: no worse, and no better. Same return, same danger as plain uniform leverage. At 3x, concentration bares its teeth and the odds of halving the account double.
When you want aggression, the right move is running the verified blend uniformly hotter (the risk presets exist precisely for that), not leaning into one asset. Aggression and concentration are different things. A realized trend is not a free lever.
Road 2: the easier new plan (study 231)
Next, a change on the prop firm’s side: a July 2026 “fast-track” plan with a +6% target, -2% daily limit, and -3% max drawdown. The low target looks friendly.
The plan’s fate was decided by a single number. My EA’s worst full-risk intraday day is -3.04%. The plan’s exit door is -3%. One ordinary worst day is the exact size of elimination. Leverage must be slashed to live there at all.
Slashed and measured: passing works. At a leverage factor around 0.6, the challenge succeeds about 75% of the time, median 138 days, 7% disqualification. With the cheap entry fee, it functions as a fast, low-cost credential (though the classic plan, where the same distribution supports k1.5, passes 91.5% of the time in 84 days, so even here it compares poorly).
The afterlife is where it dies. The -3% floor is permanent, pinning leverage near 0.5 forever:
| Plan | Operating leverage | Monthly payout | 1-year survival |
|---|---|---|---|
| New plan | k0.5 | 0.22% | 96.9% |
| Classic plan | k1.5 | 1.10% | 98.1% |
One fifth of the payout AND worse survival. The system’s PF stays at 1.69 throughout, so this is not an engine problem; it is a container problem. For a project whose goal is recurring payouts, the structure simply does not fit.
Verdict: conditional rejection. The only sensible use is a disposable pass: take the cheap credential once, cash a minimal payout, close the account. I kept the classic -5%/-10% plan.
Road 3: self-multiplying accounts (study 243)
The main event. Zero additional personal capital: payouts fund the next account’s entry fee, and the fleet grows out of its own cash flow. Does the loop actually close? I simulated 6,000 worlds over 24 months.
The honesty constraint I cared most about: every account walks the same market path. Running the same EA on multiple accounts creates no statistical diversification, so the model shares one market path across the fleet rather than fabricating independence. Only 80% of each payout (the profit split) enters the cash pool, which pays the 69,800-yen fees and any post-disqualification retries.
The base run:
- First income lands at month 6 (median), consistent with the separately measured 143 trading days to first payout
- Cumulative take-home at 24 months: median 4.1M yen (10th percentile zero, 90th percentile 22.4M)
- Months 19-24 average income: median 273k yen per month (75th percentile 1.11M)
- Active accounts at month 24: median 5 (the cap)
Two thorns in the distribution’s shape. First, the median single month stays at zero for long stretches: payouts arrive in bursts after cushion rebuilding, a lumpy stream rather than a salary. Second, and critically, 14.9% of worlds shipwreck entirely: fail before the first payout, and the empty pool cannot fund a retry. The whole path halts.
Seventy thousand yen changes the distribution
Now the discovery that headlines this article. Hold back exactly one entry fee (69,800 yen) as a strand-only reserve, and:
| Reserve | Shipwreck rate | No income in 24 months | Cumulative (median) |
|---|---|---|---|
| None | 14.9% | 15.4% | 4.1M yen |
| One fee (70k) | 2.38% | 3.3% | 4.86M yen |
The shipwreck rate collapses to roughly one sixth. More important than the median improvement (+0.76M) is the severing of the lower tail: even the bottom decile stops being zero. This is not an income booster; it is a physical cut of the ruin path. Where risk is asymmetric, the smallest hedge does the largest work, and this is as clean an example of that principle as I have ever measured.
Robustness held too: in the stressed world (volatility times 1.1, costs times 1.3 simultaneously), the road survives at a cumulative median of 1.85M yen, with the reserve compressing the elevated shipwreck rate the same way.
Scoring the three roads
| Road | Verdict | Decisive factor |
|---|---|---|
| More gold | rejected | tail never improves, worsens at 3x; riding a realized trend |
| The new plan | conditionally rejected | permanent -3% floor crushes payouts to one fifth |
| Parallel accounts | adopted | closes the loop on zero capital, IF the reserve exists |
The action items reduce to two. First, the current live challenge surviving is everything: the fleet’s seed is the one ship already sailing. Second, if possible, set aside 69,800 yen as shipwreck insurance.
Three studies into “earning more”, and the final instruction is “keep one fee in an envelope”. Anticlimactic, perhaps. But translate any expected-value debate into ruin-probability terms and the answers usually turn humble, and the humble answers are the ones that work. The underlying system (PF 1.69, +1.06% monthly) was never touched throughout.