Five times I doubted the system that won 10 of 11 years, five times the answer was keep it
Five robustness audits of a locked-in trading system: filter symbols, pyramiding, year-by-year results, full walk-forward selection, parameter sensitivity, a long-and-short hedge conflict, and a re-measurement after data bugs. Every audit ended the same way, and that is the point.
The most frequent verdict I have handed down on my own trading system over the past half year is “change nothing.” Is the filter symbol right? Shouldn’t I add to winning positions? Is the track record just one lucky year? Are the parameter values a fluke? Is it a bug that the system holds a long and a short on the same currency at once? And after I found real bugs in my data pipeline, did the conclusions even survive? Five audits, five different angles of attack, and five times the numbers came back: the current configuration is optimal.
That may sound like five chapters of nothing happening. In automated trading, though, being able to say “leave it alone” with measurements behind you is an asset in itself. This article collects the whole lineage of those audits into one story.
First time here? What you need to know
For new readers: this blog is a verification diary. I (one person) build my own automated FX trading program (an EA), statistically test trading methods, and publish everything, wins and losses alike. “Study N” refers to my numbered research log. The system is a portfolio of component strategies I call sleeves (trend following, mean reversion and so on), managed under version numbers like v1.3.1 and v1.5.0.
Four terms. PF (profit factor) = gross profit over gross loss, above 1 means profitable. DD (drawdown) = the fall from an equity peak, the mountain-climber’s “how far below the summit are we.” MC = Monte Carlo pass rate, the probability of passing prop-firm style rules estimated by resampling daily returns. And “monthly return at 10% DD” means risk is first scaled so that maximum drawdown equals 10%, so different setups compare on the same yardstick.
Prologue: the last real improvement was worth +11% (study 93)
Ironically, the story starts with a verification that succeeded. Against the then-current Core v1.3, I put three untested levers on trial, at an operating point where drawdown reaches -15%.
| Change | Monthly | PF | DD | Ruin prob. | Calmar |
|---|---|---|---|---|---|
| Status quo (v1.3) | 0.71% | 1.48 | -8.8% | 6.8% | 0.93 |
| Raise vt_cap to 3.0 | 0.71% | 1.48 | -8.7% | 6.4% | 0.94 |
| Add Connors sleeve | 0.78% | 1.45 | -10.1% | 7.2% | 0.77 |
| Extend vol-target to sat2 | 0.79% | 1.57 | -9.5% | 6.1% | 1.05 |
Only one of the three was real: extending vol-target (lot sizing that adapts to recent realized volatility) to the sub-strategy sat2. The core and sat2 correlate at 0.54, which made that pair the drawdown bottleneck, and this change hit it directly. It was also the only row where the Calmar ratio (return divided by drawdown, a measure of efficiency) improved. Adding the Connors sleeve looked tempting on return but grew drawdown even faster, which is just leverage in a costume.
Adopted as v1.3.1: monthly return 0.71% to 0.79% (+11%), PF 1.48 to 1.57, MC 93% to 94.3%, and a worst intraday day of 2.79% when the account path is rebuilt from 1-minute bars. And the study closed with a declaration: diversification and indicator-adding had effectively hit their ceiling here. Every proposal after this point would be a challenge to that claim.
Audit 1: reopening two rejected ideas (study 112)
After an upgrade to v1.4.0, which uses a stock index as a risk-sentiment filter, came the first audit: two previously rejected ideas, retried on the new configuration.
First, the filter symbol. My core FX sleeves trade yen crosses, so surely a yen-denominated index like JP225 (the Nikkei) should read the environment better than US500 (the S&P 500)? Measured at 10% DD, US500 delivered +0.22% monthly, JP225 +0.18% (no better than running without a filter), and requiring both +0.20%. The US market leads global risk sentiment, so as an early-warning gauge for risk-off, US500 simply works better. A plausible hypothesis lost to the incumbent.
Second, pyramiding, adding to positions as they move into profit. With total risk normalized to the standard setting, the standard configuration earned 0.23% monthly, a maximum of 2 add-ons earned 0.21%, and 3 add-ons 0.19%. Strictly worse with every extra tier: average exposure shrinks, capital sits idle, and return erodes faster than risk. The audit ended by reconfirming that the current system sits on the efficiency frontier of this price data.
Audit 2: year by year, then fully walk-forward (study 135)
At v1.5.0 I turned the doubt onto the whole system. Run with frozen parameters over the past 11 years, it was profitable in 10 of 11, the sole loss being 2018 at -3.6%, with within-year maximum drawdowns between -2.3% and -8.2%. So the record does not hang on one lucky year. But what if the choice of currency pairs itself was hindsight?
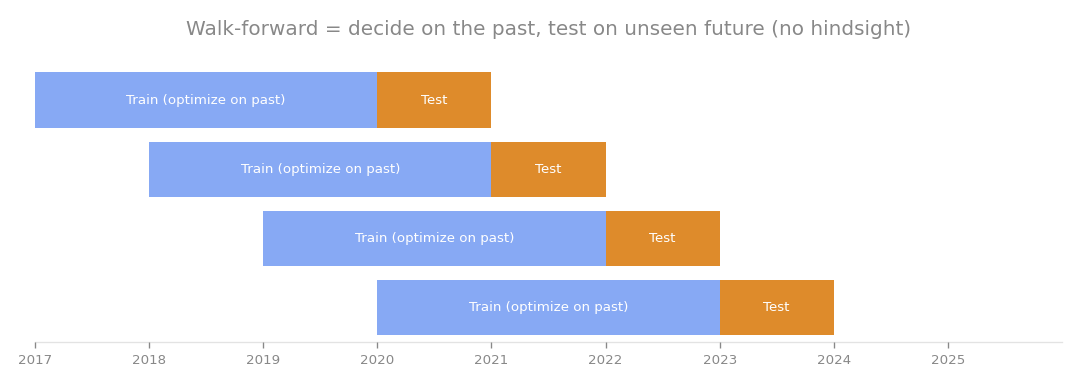
The walk-forward idea: repeat “decide on the past, grade on the future” so hindsight cannot sneak in.
The hindsight check was a fully walk-forward selection contest. In one corner, my fixed lineup robust5 (yen crosses plus gold). In the other, a re-picker that each year selects the pairs with the best PF up to that point and trades them on the unseen following year.
| Method | Total return | Winning years |
|---|---|---|
| Fixed robust5 | +131.3% | 7 of 7 |
| Naive walk-forward re-picking | +63.0% | 5 of 7 |
The fixed lineup won on both counts. The re-picker stumbled in 2019 and 2021 by grabbing pairs like EURAUD and GBPNZD, which had high recent PF but then failed to trend. In other words, robust5 is not a curve-fit collection of past winners; it rests on a structural fact, that yen crosses are where trends happen. The one caveat is known and documented: this strength presumes the yen-weakening, gold-strengthening environment continues, and that regime is under standing surveillance.
Audit 3: shoving every parameter to see if it breaks (study 135, continued)
Next, the parameters themselves. If good results only appear at exactly these values, the system is balanced on a knife edge and any real-world drift will cut it. I swept the risk allocation between sleeves, four settings (index, sat2, Connors, core risk) with three values each.
The result: monthly return at 10% DD stayed between +0.96% and +1.01%. A spread of just 0.04%. Move the allocations and the risk-adjusted return barely stirs, so nothing depends on a magic number. The regime stress side held up too: the 2015 yen surge, the 2020 COVID crash, the 2022 bear market, the sharp 2024 yen unwind, the system survived all of them in positive territory, with 2018 (-3.6%) as the lone red year. All four checks passed, yearly robustness, principled core selection, parameter tolerance, regime survival, and the summary read: all that remains is live demo forwarding.
Audit 4: long and short the same currency at once (study 183)
Then live trading brought its own doubt. Looking at the real account, a GBPJPY long and a GBPUSD short were open at the same time. Buying pound and selling pound simultaneously, a half hedge. A bug? A design flaw? Shouldn’t one side yield? Anyone would ask.
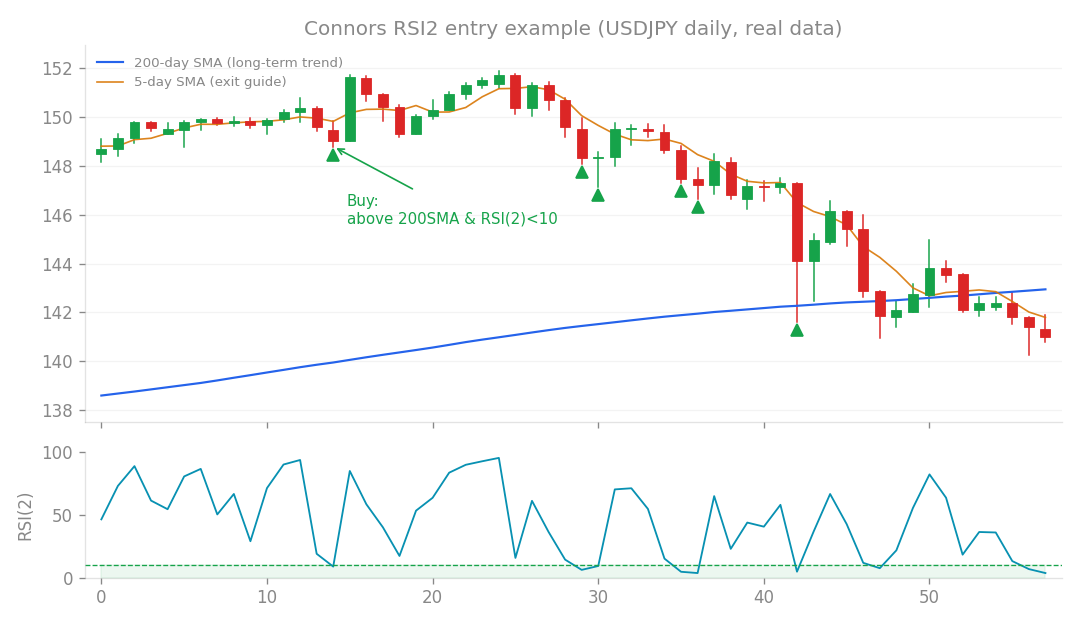
The short side belongs to Connors-LS, a short-term mean-reversion sleeve; the chart shows its long form, the short is the mirror image. It decides independently from the trend core’s longs.
Facts first. Over 2015 to 2026, the overlap occurs about 20 days a year. During those overlaps, the short side alone still wins 64.5% of the time at PF 1.30 (versus PF 1.45 when not overlapping). So “opposite position, therefore losing” is simply not the structure. Then the counterfactuals, all of them, side by side:
| Variant | PF | Monthly | DD | MC |
|---|---|---|---|---|
| BASE (no short sleeve) | 1.64 | 0.814% | -8.36% | 96.9% |
| Current (allow coexistence) | 1.62 | 0.838% | -7.89% | 97.4% |
| Conflict filter (skip shorts while long) | 1.62 | 0.835% | -8.04% | 97.4% |
| Remove shorts entirely | 1.63 | 0.822% | -9.28% | 96.8% |
Here is the fun part. Filtering out the overlap made drawdown worse, and deleting the shorts made it worst of all at -9.28%. The half hedge partially cancels the pound exposure, working like ballast in a ship’s hull. The short sleeve is an independent edge in its own right, and when it happens to overlap the longs it moonlights as a risk reducer. The verdict after all that suspicion: leave it exactly as it is, the current setup sits in the best range on monthly return, DD and MC alike.
Audit 5: data bugs, and “you’d have done better just holding NVDA” (study 191)
The last audit stung the most. In a parallel verification track on stock swing trading, I found bugs in my data pipeline. Some symbols were missing from the universe, and a split-adjustment quirk had wrongly excluded big multi-baggers. Which means I had been claiming “beats the market” on a universe that did not contain NVDA. On top of that, a reader told me flatly that just holding Nvidia would have been better. Conclusions have died for less.
I fixed the bugs, widened the universe to 105 symbols, and re-measured. The refined core: +0.98% monthly, PF 1.54, max DD -23.55%. The confirmed reference variant: +1.14% monthly, PF 1.56, DD -26.05%. Against a null of market-average performance, the strategy stayed positive with at least 96% probability in every one of five eras from the global financial crisis to today. The conclusion came out of surgery stronger than it went in.
And the quantitative reply on NVDA. Holding it for 21 years earned +2.71% monthly, genuinely superb. It also carried a maximum drawdown of -85.1%, including a -66.4% collapse in 2022 alone. And NVDA ranks first for monthly return among the 80 stocks that survived the full 21 years, which is to say the comparison assumes you knew the future winner in advance. Across those 80 buy-and-holds, the median drawdown was -65.4%, and more than half fell over 60%.
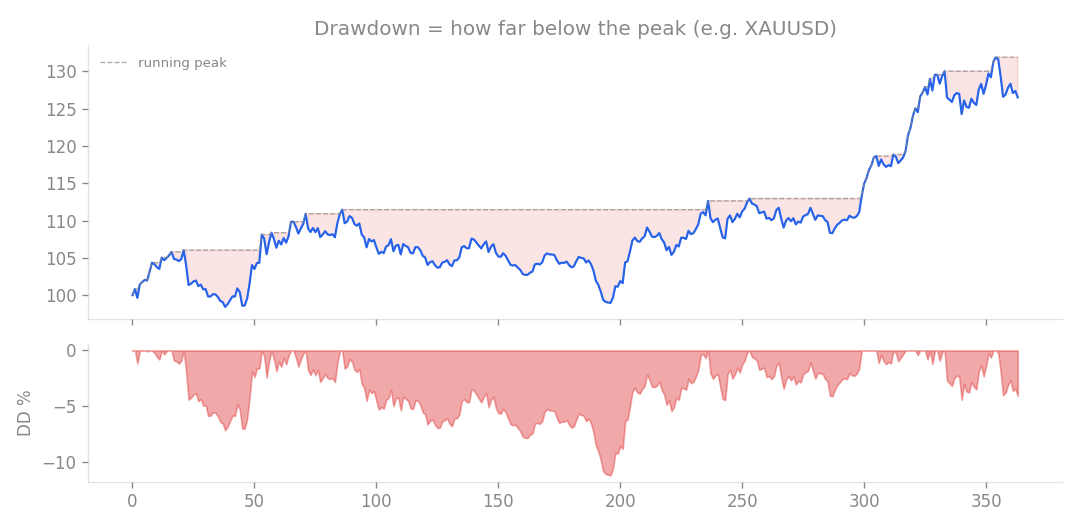
How to read a drawdown. If +2.71% a month comes with an -85% valley, it is not the same “good deal” anymore.
The strategy’s job was never to pick tomorrow’s winner. It is to beat the market average with discipline, at roughly one third of the market’s drawdown, without knowing which stock wins. After the most dangerous audit of the five, that skeleton was still standing.
What five audits actually bought
Lined up, the five doubts each strike a different vital point: component choice (112), robustness through time and hindsight (135), parameter sensitivity (135 continued), the rationality of live behavior (183), and data quality itself (191). That all five landed on “current is optimal” says less about brilliance than about two habits. The system had already been polished to its diversification-plus-vol-target ceiling back at v1.3.1, and every verdict since has been passed with the same yardsticks, PF, monthly return, DD and MC, plus hindsight killers like counterfactual comparisons, null baselines and walk-forward selection.
Rejecting improvement after improvement is unglamorous. But “don’t change it” is only a judgment, rather than laziness, if you actually measure it. Asking five times and getting the same answer five times is where the nerve to run this system with real money comes from. The one known weakness is also singular and named: dependence on the weak-yen, strong-gold regime. That is not something to fix. It is something to watch.
This article consolidates studies 93, 112, 135, 183 and 191.