The defenses held in six crises they had never seen
Adding defensive filters to an algorithmic strategy is often a gamble, but recent stress testing shows that my current G4 shock guard and equity…
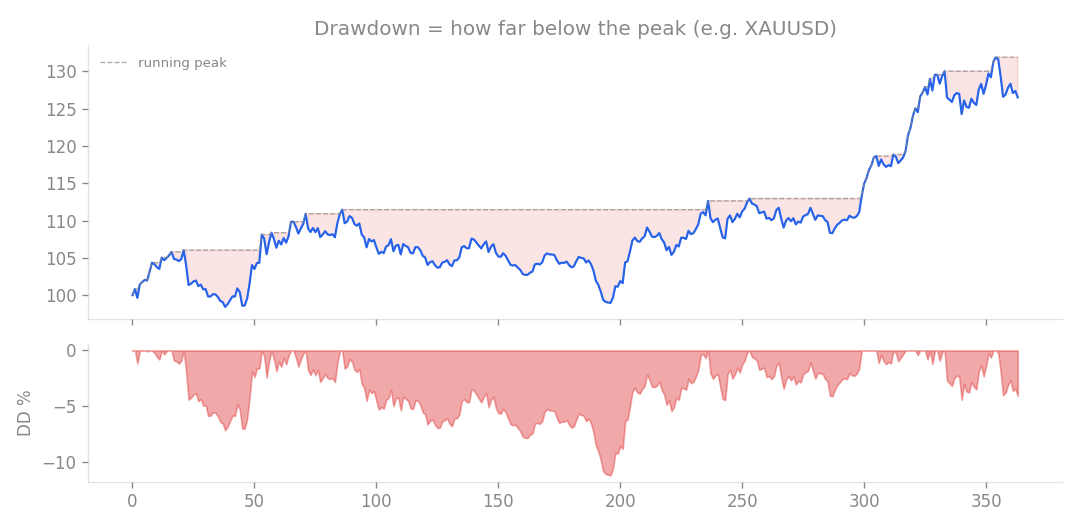
Drawdown = how far the account falls below its running peak (e.g. XAUUSD). The depth of this valley is what risk feels like.
Adding defensive filters to an algorithmic strategy is often a gamble, but recent stress testing shows that my current G4 shock guard and equity filter are genuinely robust. I audited both systems against six major market crises, including the 2015 China crash, the 2020 COVID volatility, and the 2024 Carry trade unwind. Instead of just looking at the full history, I measured how these filters performed during these specific “crisis windows” to see if they could hold up against unfamiliar market conditions.
G4 shock guard performance
The G4 filter, which uses a Connors index stream to guard against sudden stock market shocks, proved remarkably consistent. In four out of the six crisis windows, it improved the Drawdown (DD), the peak-to-trough decline in account equity, by between 0.26 and 2.00 points, with no windows showing any performance degradation.
| Metric | Current Setting | Optimized Setting (th-2%) |
|---|---|---|
| Overall Drawdown | -9.27% | -7.12% |
| Monthly Return | +0.467% | +0.480% |
| Cost (per month) | N/A | -0.037% |
| When I tested nearby parameters, the results were smooth and monotonic, meaning the system doesn’t rely on a single lucky setting that might be overfitted. In other words, the current configuration isn’t a fluke; moving to a more conservative threshold (th-2%) actually improved the drawdown across every single window. I also performed a LOCO (Leave-One-Crisis-Out) test, where I picked parameters using only five crises and tested the filter on the sixth. It reproduced the protective effect in all six cases without a single failure. |
Equity filter performance
The equity filter, which acts as a risk-off overlay based on a 200-day moving average, also demonstrated clear value. By scaling down exposure during trend-weak periods, it improved the drawdown in all six crisis windows, ranging from 0.09 to 0.78 points of improvement.
- Total Period Drawdown: Improved from -9.75% to -6.84%.
- Cost: -0.049% per month. This filter is designed to recover these costs through re-leveraging when the market stabilizes. Because it consistently reduced the total drawdown by 2.9 points, it provides a reliable foundation for the strategy.
Verdict
Both defensive layers are now officially promoted to a higher level of confidence. I have moved them from “full-sample design” to “verified forward generalization.” This means the -8.3% drawdown figure for my current configuration is built on a solid floor, which gives me more room to consider increasing capital allocation in the future. Moving the G4 filter to the more conservative threshold (th-2%) offers a Pareto improvement, meaning it makes the system better in every measured way. However, I am keeping the current settings for now. As I learned in a previous research track, reducing drawdown is not always easy to convert into higher withdrawals when running an aggressive setup. However, for a more conservative account preset, that switch is definitely worth considering.
How this connects
This verification builds on earlier ones (what failed before and what I tried this time, comparisons between approaches).