
Opening the census: 41 methods, 26 symbols, 4 timeframes
My latest research project has finally moved beyond hypothesis testing, as I have completed a full census of 41 distinct trading archetypes across 26…
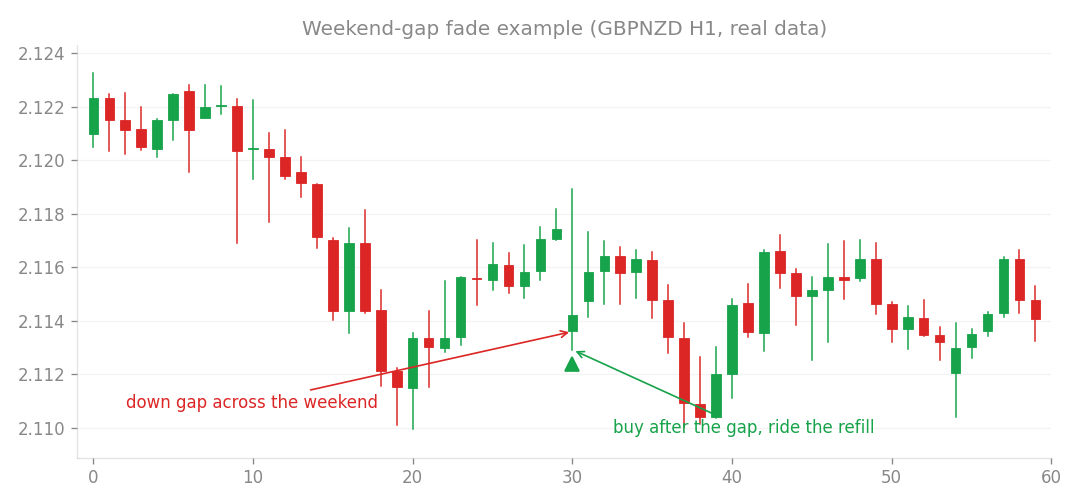
Weekend-gap fade example (GBPNZD H1, real data): trading the refill of a down gap across the weekend.
My latest research project has finally moved beyond hypothesis testing, as I have completed a full census of 41 distinct trading archetypes across 26 assets and four timeframes (H1, H4, D1, W1). By running an exhaustive backtest of 3,680 combinations from 2015 to May 2026 using standardized parameters and a 1% risk per trade, I aimed to identify which strategies truly hold up under statistical scrutiny. To ensure the results weren’t just lucky streaks, I split the data into an in-sample period (up to 2022) and two out-of-sample (OOS) periods, including a fresh 2025-2026 window. I then applied a Benjamini-Hochberg False Discovery Rate (FDR) correction at a 0.10 level to filter out noise. In other words, I used a strict statistical filter to identify which strategies are likely to have a genuine edge rather than just appearing profitable by chance.
The survivors of the census
Out of 3,193 tested combinations, only 13 strategies successfully passed the FDR filter. These survivors fall into two primary families:
- Weekend Gap Fade (H1, 10 assets): This was the most robust performer with the highest OOS t-statistic reaching 7.96. It showed consistent performance across both OOS periods.
- Turn-of-the-Month (H1, 3-4 assets): This includes pairs like EURNZD, CHFJPY, and USDCHF. Unlike the traditional daily timeframe version, the H1 implementation holds positions only for the two to three hours surrounding the month-end transition. Other strategies, such as weekly round-number trades, yielded very few survivors and are currently being treated as statistical noise. Meanwhile, gold (XAUUSD) trend strategies and CHFJPY Connors-style strategies performed well but largely mirrored existing logic I already have in production.
Verdict and next steps
The census itself is a success, and I now have a robust framework for automatically testing new ideas. The two survivor families share a common theme: they exploit liquidity dynamics at market boundaries, specifically the opening of the week and the changing of the month. Because these periods are often characterized by wider-than-normal spreads, the true profitability of these strategies hinges on how they handle execution costs. My next focus is on precision testing for these boundaries:
- Measuring actual spreads: I need to perform a real-world spread measurement at the month-end transition similar to the method I use for weekend gaps. My initial tests show that the “Turn-of-the-Month” H1 strategy fails if I account for even a minor slippage of 1 point, making this measurement critical.
- Evaluating existing sleeves: I will integrate the successful gold and CHFJPY variants into my existing strategy sleeves as incremental upgrades.
- Ongoing monitoring: Since the W1 (weekly) strategies lack sufficient sample size, I will wait for more data to accumulate before drawing further conclusions. I plan to re-run this full census annually to let the latest market data serve as the final judge.
How this connects
This verification builds on earlier ones (what failed before and what I tried this time, comparisons between approaches).