After 200 attempts, is anything still statistically real?
The edge in my Core trading system is statistically robust, even after accounting for selection bias.
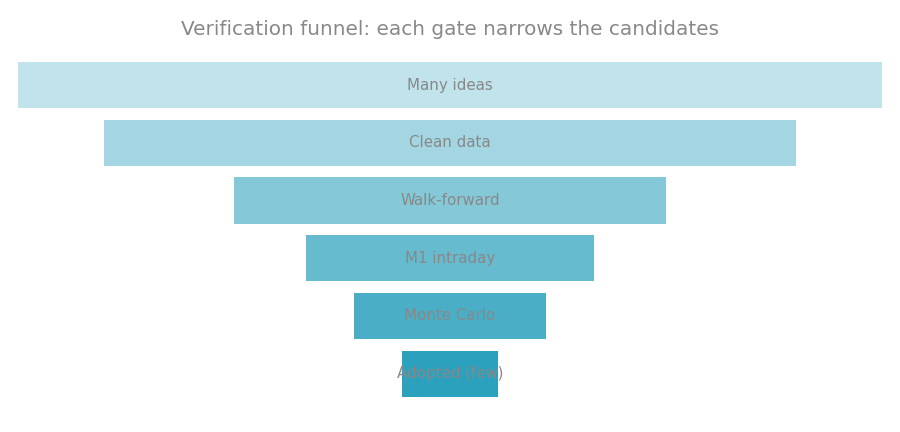
The verification funnel: many ideas enter, and only a few survive clean data, walk-forward, intraday and Monte Carlo gates.
The edge in my Core trading system is statistically robust, even after accounting for selection bias. By integrating a more rigorous testing framework into my pipeline, I have confirmed that the system’s performance is not merely a result of data mining or random chance.
The new testing framework
I have recently overhauled my analysis tools to better handle the statistical traps that often plague algorithmic trading. The new stats.py module introduces three key components:
- Random timing tests: I now standardize how I compare my strategy against random entry points. This helps reveal whether my timing actually adds value or if I am just getting lucky with market noise.
- DSR (Deflated Sharpe Ratio): Developed by Bailey and Lopez de Prado, this metric calculates the probability that a strategy is profitable given the number of different variations tested. In other words, it adjusts the Sharpe Ratio (a measure of risk-adjusted return) downward to account for how many “failed attempts” were hidden behind the final result.
- Multiple testing correction: When you test many ideas, some will look good by pure luck. I now use FDR (False Discovery Rate) corrections to ensure that if I claim a strategy has an edge, it holds up even under strict scrutiny.
Validating the Core system
I put my Core v1.6.0 system (covering 2015 to 2026) through this new battery of tests. The daily Sharpe Ratio sits at 0.0905, which translates to roughly 1.44 on an annualized basis. When I run the DSR, I adjust for the “research effort” (the number of variations explored). Even if I assume I tested 200 different versions, the DSR remains at 0.9865. Since this is well above the 0.95 threshold, it confirms that the edge in the Core system is genuine and cannot be explained away as the best result among many random attempts.
Individual sleeve performance
While the portfolio as a whole is robust, the story changes when looking at individual components. I analyzed the seven individual “sleeves” (sub-strategies) within the system using BH-FDR correction to see if their specific entry timing offered a statistically significant advantage. The result was sobering. My best-performing sleeve, Gold, showed a raw p-value of 0.064. However, after applying the FDR correction, the adjusted p-value rose to 0.215. This means that, statistically speaking, none of the individual sleeves have a proven “entry alpha”. In other words, I cannot definitively prove that the specific timing of any single sleeve is better than chance.
What this means for my trading
This finding reinforces a critical lesson: the real edge of my system does not lie in the individual entry timing of any single sleeve, but in the portfolio structure itself. The combination of uncorrelated assets, disciplined risk control, and tail-event capture is what drives the results. Moving forward, I will stop investing research time into trying to perfect the entry timing of individual sleeves. Instead, my new standard for adopting any new sleeve will be a strict three-part test: out-of-sample consistency, a random timing control test, and a DSR calculation that accounts for the number of variations explored during development. The Core system remains the foundation of my trading, now backed by a more transparent and honest statistical framework.
How this connects
This verification builds on earlier ones (what failed before and what I tried this time, comparisons between approaches).
- In stocks, only buying weakness works. Buying strength loses to…
- Our PF 4.17 star sleeve was just beta in disguise
- That VWAP scalping video re-heats ideas we already tested
Code to reproduce
You can reproduce this with the following scripts (see repo).
btengine/stats.py