
Our PF 4.17 star sleeve was just beta in disguise
I recently applied a null-hypothesis test to my current FX, metal, and index trading sleeves to see if my entry timing actually provides value.
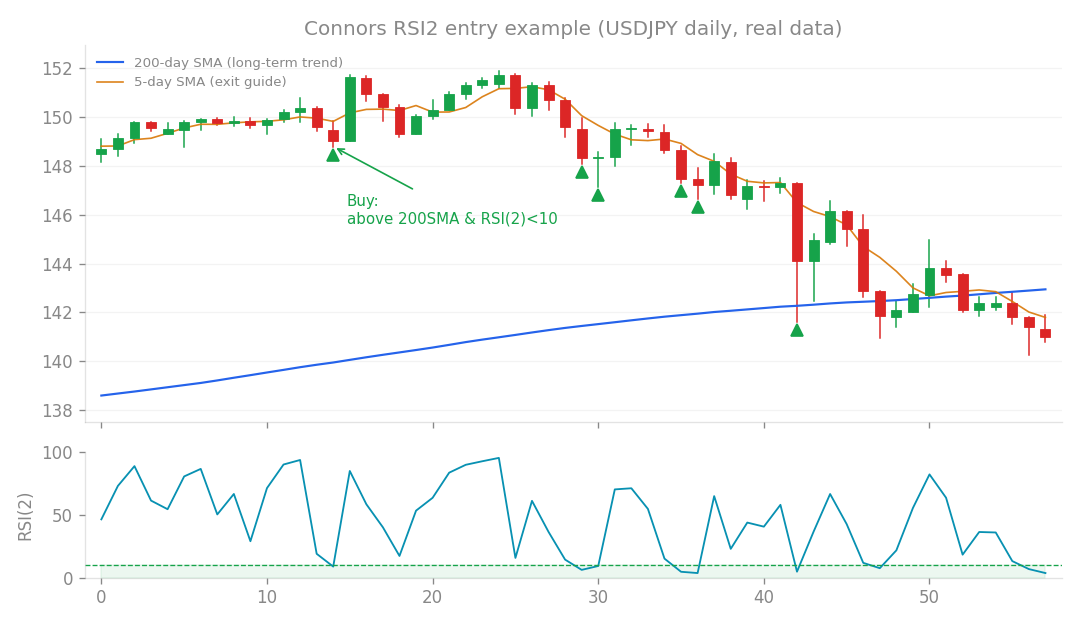
Connors RSI2 entry example (USDJPY daily, real data): buy the dip when price is above the 200-day SMA and RSI(2) falls below 10.
I recently applied a null-hypothesis test to my current FX, metal, and index trading sleeves to see if my entry timing actually provides value. By comparing my real trade entry points against 500 random, simulated entries with the same holding periods, I can calculate a percentile score (pct). A score of 95 or higher suggests the entry timing has genuine value, while 80 or lower suggests the performance is just capturing market beta (the general movement of the market).
Entry timing: What survived the test?
| Strategy | FULL (pct) | IS (pct) | OOS (pct) | Verdict |
|---|---|---|---|---|
| Gold ATR | 93.6 | 87.6 | 88.0 | Robust |
| Connors | 92.4 | 60.0 | 92.4 | Robust |
| Seasonal | 90.8 | 85.8 | 82.4 | Robust |
| FX Core | 72.6 | 80.6 | 18.4 | Overfitted |
| sat2 | 87.2 | 87.0 | 64.4 | Overfitted |
| Indices | 46.8 | - | - | Pure Beta |
| Note: IS = In-Sample (pre-2020), OOS = Out-of-Sample (2020 onwards). |
Key takeaways from the results
- The “True” Edges: The Gold ATR candle, Connors (mean reversion), and seasonal strategies (April/December) are consistent. In other words, their entry timing provides a genuine advantage that holds up even when tested against random noise. The fact that the Connors strategy performed better in the OOS period is a strong sign that it isn’t just a result of curve-fitting.
- The “Pure Beta” Trap: The index sleeve (US500/100/30) is essentially pure beta. While the strategy has a Profit Factor (PF) of 4.17 and a Sharpe ratio of 0.76, the test shows the entry timing has zero “alpha” (unique value). In other words, you would have achieved similar results simply holding the market, as the performance is driven entirely by the long-term bullish trend of stocks rather than my specific entry rules.
- Overfitting Signals: The FX core and “sat2” strategies showed classic signs of overfitting: high performance in the IS period that decayed significantly during the OOS period. For FX core, the entry timing is essentially random, meaning the real value of that sleeve lies elsewhere, like in the exit rules, position sizing, or diversification.
What this means for my actual trading
This verification doesn’t mean the “failing” strategies are worthless, but it changes how I view them. For the index sleeve, I now know that trying to refine the entry timing is a waste of time. It is a pure beta play, so I should treat it as a diversification tool rather than an active trading strategy. For the FX core, since the entry timing doesn’t provide an edge, I should stop trying to tune the entry parameters (like entry_n) and instead focus my research on exit logic and sizing. Finally, I will treat the “sat2” sleeve with the most caution, as it shows clear signs of performance decay and lacks an independent edge. My next step is to run similar null-hypothesis tests on my exit and sizing logic. If the entry timing isn’t the “engine” for some of these strategies, I need to isolate what is actually driving the profit.
How this connects
This verification builds on earlier ones (what failed before and what I tried this time, comparisons between approaches).
- I tested a free EA from the internet, and part of it was…
- Using stock-market signals to de-risk FX: a new axis that worked
- Connors RSI2: the first mean reversion that truly added returns
- In stocks, only buying weakness works. Buying strength loses to…
- A small but real defense: de-risking when volatility explodes