A small but real defense: de-risking when volatility explodes
In my previous research, I focused on the "G4" guard, a mechanism that scales back positions when the US500 drops more than 3% over five days.
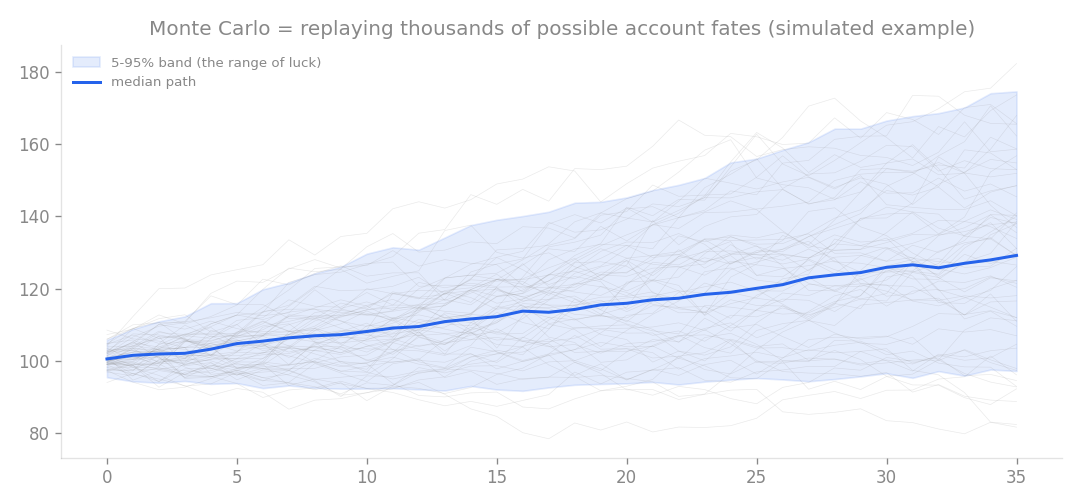
How Monte Carlo works (simulated example): replay thousands of possible account fates and judge the whole range of luck.
Anatomy of a Drawdown: Can we trim the fat?
In my previous research, I focused on the “G4” guard, a mechanism that scales back positions when the US500 drops more than 3% over five days. It effectively handles mean-reversion clusters, but I noticed it was missing something. When analyzing the anatomy of my worst drawdowns, I found that “volatility-momentum” clusters (specifically when gold volatility spikes) were consistently driving the heaviest losses, such as those seen on dates like November 9, 2016, and August 6, 2015.
I tested a new guard to address this: when the volatility ratio of gold or the Japanese Yen exceeds 1.5, I cut the leverage of my sat2 and tjl strategies by half for a five-day hold.
The initial promise vs. the engine reality
My preliminary daily simulations looked promising. I expected to reduce the maximum drawdown (DD) from -7.65% to around -6.9% or -7.0% without sacrificing monthly returns. In fact, the initial numbers suggested I could even boost returns by roughly +0.13% to +0.21% per month by increasing the capital allocation (kcap) while keeping the same risk of ruin. However, there was a catch. My initial simulation assumed I could cut all positions in half during these volatile periods. In reality, my trading engine only scales back new positions, leaving existing trades untouched. When I ran this through the actual engine, the results shifted:
| Metric | G4 Only | G4 + New Guard |
|---|---|---|
| Monthly Return | +0.982% | +0.951% |
| Maximum DD | -8.38% | -7.95% |
| M1 Worst Day | -2.74% | -2.74% |
| While the new guard did shave 0.43 percentage points off the drawdown, it came at a cost of -0.031% in monthly returns. The “free lunch” I had hoped for disappeared once I accounted for how the engine actually manages active trades. |
Verdict: Why I am shelving this update
After verifying the impact on the probability of ruin (MC), I found that the guard does indeed lower the risk of blowing an account. At a kcap of 2.5, the ruin probability drops from 5.5% to 4.5%. But at that same level, the monthly return also dips. In short, this isn’t a strategy for increasing my monthly payout; it is a tool for trading safety. If I am running an account aggressively, the G4 guard has already hit the “ceiling” for what I can extract from the market. Any further reduction in cumulative drawdown doesn’t translate into extra profit; it just swaps potential returns for a lower risk of ruin. Because the guard triggers about 70 days per year (roughly 19% of the time), it introduces a risk of over-optimization that outweighs the marginal safety gains for my current setup. I am officially passing on this deployment. For those interested in scaling, the path forward isn’t in these complex surgical guards, but in the simpler, more reliable territory of capital scaling: increasing the number of accounts or the total capital size itself.
How this connects
This verification builds on earlier ones (what failed before and what I tried this time, comparisons between approaches).