
A 30% chance per year of touching -5%: know your odds
Adding a circuit breaker to an EA is like installing a fuse in your house, but it helps to know how often that fuse is actually going to blow.
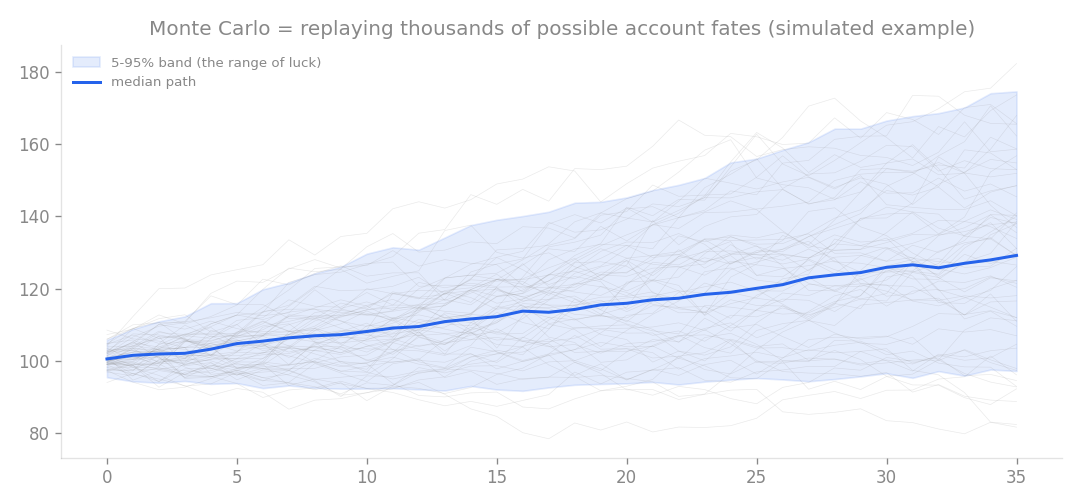
How Monte Carlo works (simulated example): replay thousands of possible account fates and judge the whole range of luck.
Adding a circuit breaker to an EA is like installing a fuse in your house, but it helps to know how often that fuse is actually going to blow. By running 20,000 Monte Carlo simulations (a method that uses historical data to estimate the probability of various outcomes), I have mapped out the likelihood of my current EA (v1.12.0) hitting specific drawdown (DD) levels. In these tests, I simulated a three-stage management strategy that includes a daily loss limit (flat) at -4.0%. This means that if the daily loss reaches this threshold, the system closes all positions.
Daily Loss Probabilities
In a standard one-year period, the daily flat trigger of -4.0% has a 60% to 71% probability of occurring. In other words, you should expect to see the system force a full exit at least once a year. While the daily loss limit for disqualification is -5.0%, the system effectively never hits this under normal conditions because the -4.0% flat trigger acts as a safety net. The only remaining risk here is a sudden market gap that skips over the trigger.
Account Drawdown (DD) Risks
The following table shows the probability of hitting specific account drawdown levels based on the current stage of the investment cycle.
| Scenario | -5% DD | -7% (System Stop) | -10% (Disqualification) |
|---|---|---|---|
| STEP 1 (Initial) | 32% / 40% | 16% / 25% | 1.1% / 4.4% |
| Post-Pass (Initial) | 11% / 16% | 4.3% / 7.6% | 0.14% / 0.69% |
| Steady State (1 Year) | 30% / 44% | 11.8% / 21.4% | 0.11% / 0.81% |
| Note: The two figures in each cell represent “normal market conditions” vs. “stressed conditions” (volatility increased by 1.1x and worst-case losses by 1.3x). |
How to Interpret These Numbers
It is helpful to look at these probabilities as part of the system’s life cycle rather than just abstract percentages:
- The “Normal” Zone: Drawdowns between -2% and -4% are essentially part of the EA’s standard operating procedure. They are expected to happen. This aligns with the baseline performance of the core engine (v1.6.0), which historically shows a monthly return of approximately 0.82%, a PF (profit factor) of 1.66, and a maximum drawdown of -7.7%.
- The -7% Safety Stop: This is the point where the EA permanently halts and liquidates all positions. With a 12% probability of occurring annually, this is an event that requires you to manually decide whether or not to restart the system.
- The -10% Limit: The values listed for -8% to -10% represent a conservative upper bound. Because the system shuts down at -7%, a -10% disqualification only occurs if there is a massive market gap that jumps past the -7% trigger.
- The Vulnerable Period: The “steady state” figures show that the system is most fragile during the first year, particularly before the 15% capital buffer is fully accumulated. Most of the recorded drawdown risks are concentrated in this early phase.
How this connects
This verification builds on earlier ones (what failed before and what I tried this time, comparisons between approaches).