
Tripling the universe doubled the drawdown, not the returns
Expanding the trading universe to include smaller, high-volatility stocks does not improve portfolio performance, despite increasing the number of…
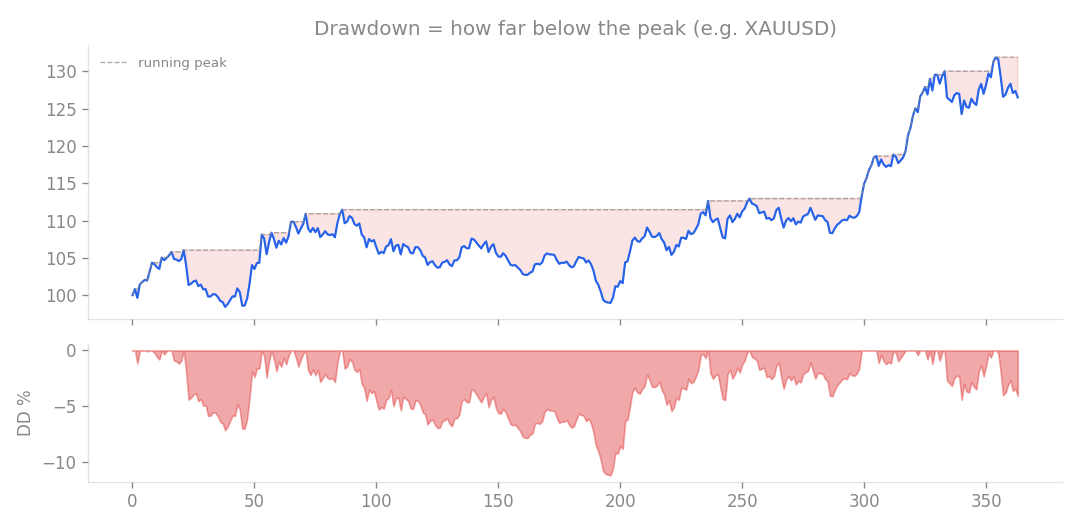
Drawdown = how far the account falls below its running peak (e.g. XAUUSD). The depth of this valley is what risk feels like.
Expanding the trading universe to include smaller, high-volatility stocks does not improve portfolio performance, despite increasing the number of available signals. After testing 338 tickers (including small-cap tech, biotech, energy, and fintech), I found that while the investment rate jumped from 30% to 55%, the actual returns remained stagnant and the risk profile significantly worsened. The following table summarizes the performance of the expanded universe compared to the existing, optimized mega-cap strategy.
| Metric | Expanded (338 Tickers) | Mega-Cap Baseline (104 Tickers) |
|---|---|---|
| Monthly Return | +1.21% to +1.40% | +1.14% |
| Profit Factor (PF) | 1.27 to 1.33 | 1.56 |
| Drawdown (DD) | -43% to -46% | -26.1% |
| Note: PF is the ratio of gross profit to gross loss, where a value over 1 indicates profitability. |
Why the expansion failed
My hypothesis was that adding more tickers would provide more opportunities and better diversification. While the number of trades increased by 3.6 times, the quality of those trades diluted. The average profit per trade dropped to +60.1 basis points (bp) compared to +71.6 bp in the mega-cap strategy. The most significant issue was the drawdown. During the 2020 to 2022 period, small-cap stocks suffered a collective crash. Because these stocks are highly correlated during market stress, the expected diversification benefits failed to materialize, causing the drawdown to roughly double. Furthermore, when I accounted for the higher effective spreads typical of smaller stocks by adding a 10bp cost buffer, the monthly return dropped to +1.02%.
The edge exists, but the risk does not
I compared these results against a null hypothesis to see if the edge was real. The strategy showed a consistent outperformance of +23.5 to +78.3 bp, with a 91% to 100% probability of beating a random entry. In other words, the market edge is present in small-cap stocks, but capturing it does not improve the portfolio’s risk-adjusted returns.
Final verdict
I am rejecting the universe expansion. After testing various levers (such as entry thresholds, position concentration, volatility prioritization, ATR-based limit orders, and leverage), I have concluded that the limit for a cash-equity mean-reversion strategy is a monthly return of 1.1% to 1.5%. The “mega-cap only” strategy (104 tickers, thr10, -2% limit order, SMA5 exit, f20max5) remains the most efficient configuration. Claims of achieving 5% to 8% monthly returns using cash equities are not supported by my data. I am now closing the book on these growth levers; this ceiling appears to be the structural limit for this type of technical trading.
How this connects
This verification builds on earlier ones (what failed before and what I tried this time, comparisons between approaches).