
Recomputing the path from pass to payout: 32% faster
Updating my three-stage EA management plan for v1.12.0, which includes the stock shock guard and refined entry logic, has led to a significant boost…
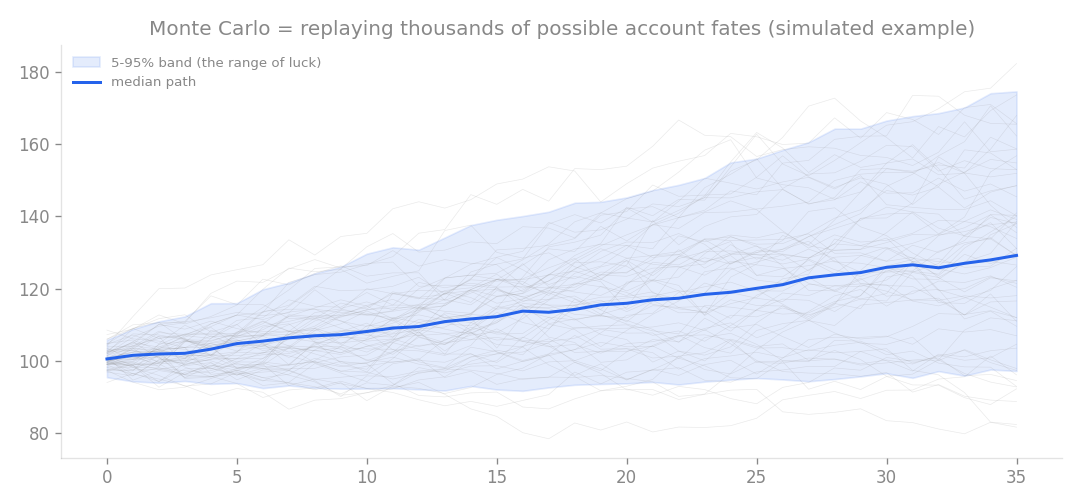
How Monte Carlo works (simulated example): replay thousands of possible account fates and judge the whole range of luck.
Updating my three-stage EA management plan for v1.12.0, which includes the stock shock guard and refined entry logic, has led to a significant boost in performance. By re-evaluating the parameters for the challenge, initial withdrawal, and steady-state phases, I have optimized for both speed and capital efficiency.
Phase 1: The Challenge
I tested a range of values for the challenge phase (the initial stage of prop firm testing). While increasing the capital multiplier (kcap) to 3.0 or 3.5 can reduce the median time to pass by 7 to 17 days, the benefits diminish quickly. Higher settings trigger the maximum open risk rule, a safety feature that caps total exposure at 3% and effectively throttles performance. Because I am currently running an active challenge, I have decided to keep the kcap at 2.5. It remains the most balanced setting, avoiding the unnecessary stress of higher volatility.
Phase 2: Initial Withdrawal
Once a prop account is funded, the goal shifts to reaching the first withdrawal as efficiently as possible. By increasing the capital multiplier from 1.5 to 2.0, the median time to reach the first payout shifts slightly from 155 to 159 trading days. However, the reward for this minor delay is substantial: the median payout amount increases from ¥11.8k to ¥15.6k, a 32% improvement. Even under high-stress market simulations, the probability of reaching this milestone remains at 99.9%.
Phase 3: Steady-State Operations
For the long-term phase after the first withdrawal, I adjusted the steady-state withdrawal logic. By setting the payout rate at 15% with a kcap of 2.5, the monthly withdrawal rate rises from 1.161% to 1.815%, a 56% increase in efficiency. Interestingly, this change actually lowers the risk of account failure. While I could push the multiplier to 3.0 for a slightly higher return, it brings the system closer to the “knife-edge” of the 3% risk constraint, offering diminishing returns for the added exposure.
Updated Management Strategy
The new configuration is now live on my terminals. Here is the summary of the updated three-stage process:
| Stage | Logic |
|---|---|
| Challenge | kcap 2.5 (unchanged) |
| Pre-First Withdrawal | kcap 2.0 (up from 1.5); withdraw immediately upon the first profitable bi-weekly cycle |
| Steady-State | kcap 2.5 (up from 1.8) with 15% constant withdrawal |
| These changes move the median time to the first withdrawal down to 155 trading days, compared to 169 days under the original plan. As a reminder, the maximum open risk rule is not fully captured in Monte Carlo (MC) simulations, so real-world performance may have slightly more downside than the model suggests. However, because these figures are based on the same simulation framework as the previous plan, the relative improvement is reliable. |
How this connects
This verification builds on earlier ones (what failed before and what I tried this time, comparisons between approaches).