Dissecting my worst drawdowns produced the equity-shock guard
To understand why large drawdowns (DD) occur in my algorithmic trading systems, I recently conducted an anatomical study of my portfolio.
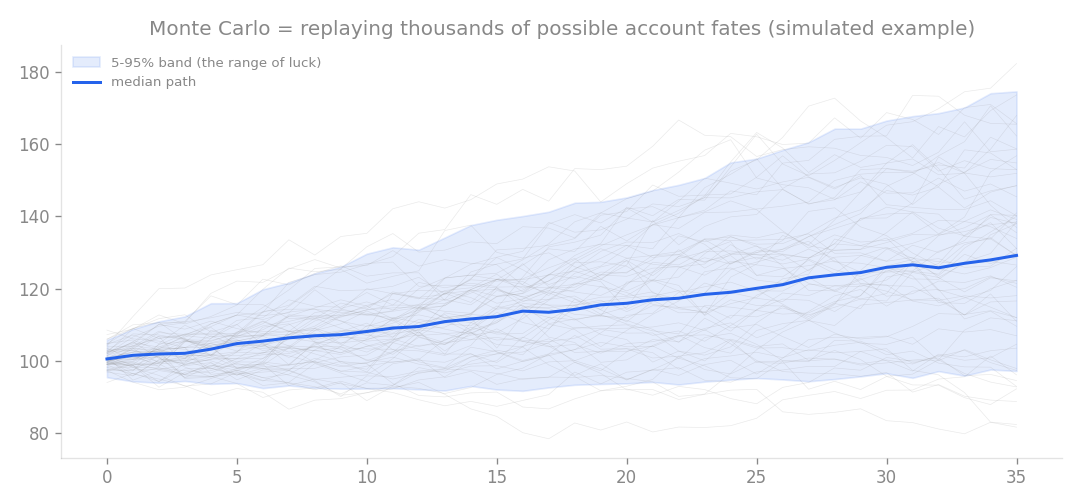
How Monte Carlo works (simulated example): replay thousands of possible account fates and judge the whole range of luck.
To understand why large drawdowns (DD) occur in my algorithmic trading systems, I recently conducted an anatomical study of my portfolio. I rebuilt the daily equity and trade history for my 10 strategy streams, covering trends, indices, and mean-reversion, to pinpoint exactly what happens during the worst days and peak DD episodes.
Anatomy of a bad day
My initial hypothesis was that these losses occurred during high-volatility spikes. The data proved me wrong. Instead, the worst days consistently arrived during “after-win” periods, when position heat (total exposure) was high and a JPY rally was underway.
The sat2 stream was the most frequent offender, often suffering from correlation hits when holding long positions across five different assets simultaneously. However, the truly catastrophic losses, like the 2018 Volmageddon or the 2020 COVID crash, were caused by a specific structural correlation: the “Connors” mean-reversion strategies and index-following strategies getting hit at the same time. These systems were essentially buying the dip while the market was in a freefall.
Testing the filters
I tested several filters to mitigate these risks, including volatility acceleration and cooldown periods after wins. Most were ineffective. The only filter that consistently improved performance was a “stock shock guard” (G4):
- The Rule: If the US500 index returns less than -3% over 5 days, I halve the exposure of the Connors, ConnLs, and Index strategies for the next 5 days.
- The Result: It reduced the worst single-day loss from -3.15% to -1.86% and lowered the overall DD from -8.80% to -6.88%. In other words, I traded less than 1% of monthly profit (dropping from 0.982% to 0.943%) to gain significant downside protection.
Scaling risk for higher returns
The most compelling part of this research is how the filter changes the math for future scaling. By running Monte Carlo simulations (a method to estimate the probability of ruin by resampling daily returns), I found that with this filter in place, the risk of bankruptcy is nearly halved for any given capital allocation.
Because the risk of ruin drops, I can justify increasing the kcap (my capital allocation parameter). Here is how the monthly withdrawal potential shifts:
| Capital Allocation (kcap) | Current Ruin Risk | With G4 Filter | Impact on Monthly Withdrawal |
|---|---|---|---|
| 1.5 | 3.3% | 1.7% | +45% (1.065% → 1.539%) |
| 1.8 | 4.8% | 2.2% | +20% (Conservative plan) |
| The conservative 1.8 allocation actually has a lower risk of ruin (2.2%) than my current, unfiltered 1.5 allocation (3.3%). This result held steady even when I excluded the 2020 COVID period, suggesting the protection isn’t dependent on a single outlier event. |
Verdict
The “stock shock” correlation between Connors and index strategies is real, and it can be effectively managed with a simple causal filter. By implementing this guard, I can safely increase my risk parameters to boost monthly returns by 20% to 45% while keeping the risk of ruin lower than my current baseline.
I am moving forward with this as a candidate for EA version 1.12. While this filter doesn’t eliminate every single-day tail risk (the sat2 correlation issues remain a separate problem to solve), it provides a robust foundation for more aggressive capital management.
How this connects
This verification builds on earlier ones (what failed before and what I tried this time, comparisons between approaches).