
The stock dip-buyer held up across 21 years and every regime
I have finally resolved the primary bottleneck in my stock swing research: the limited 23-month data window.
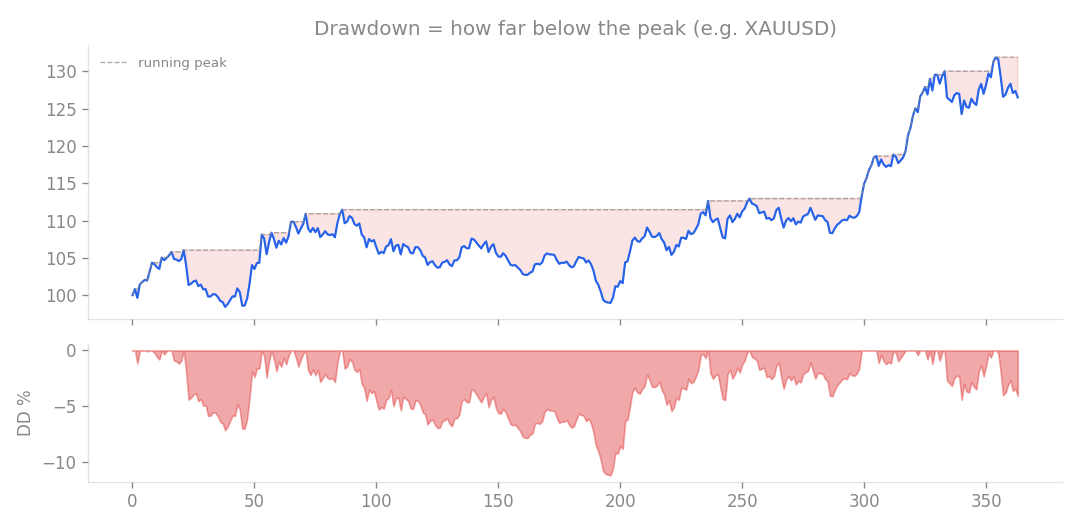
Drawdown = how far the account falls below its running peak (e.g. XAUUSD). The depth of this valley is what risk feels like.
I have finally resolved the primary bottleneck in my stock swing research: the limited 23-month data window. By bypassing standard limitations in TradingView’s data fetching, I successfully pulled up to 6,349 days of historical daily data (spanning 2001 to 2026) for a 100-stock universe plus SPY and QQQ. To achieve this, I implemented a custom script to trigger deep-history loading rather than relying on standard API tools that often fail or limit retrieval. This data was then converted into a structured format for rigorous testing.
Performance Across Different Market Regimes
I tested three variants: a baseline model, the “Core Revised” (using a -2% limit order), and a conservative version. The Core Revised strategy consistently outperformed the market across five distinct economic periods.
| Period | Core Revised Monthly Return | PF | Drawdown | SPY (Buy & Hold) |
|---|---|---|---|---|
| 2005-09 (GFC) | +1.15% | 1.99 | -10.2% | -0.14% / -56.5% |
| 2010-14 (QE) | +0.78% | 1.55 | -16.1% | N/A |
| 2015-19 (Low Vol) | +0.30% | 1.22 | -17.0% | N/A |
| 2020-22 (COVID/Bear) | +1.48% | 1.60 | -18.2% | +0.45% / -34.1% |
| 2023-26 (Current) | +1.97% | 1.83 | -13.3% | N/A |
| Note: PF (Profit Factor) is gross profit divided by gross loss. A value above 1 indicates a profitable system. |
Statistical Validation Against Random Chance
To ensure these results aren’t just luck, I compared the strategy against 200 “null” models: randomized trades using the same stock universe and holding periods. The Core Revised strategy showed a significant edge over random chance in every period. Across the entire 21-year span, the edge was +69.3bp (basis points) per trade, with a 100% probability of outperforming random noise. In other words, the strategy possesses an inherent value that persists regardless of market conditions, though it naturally performs best during high-volatility periods and thins out during low-volatility, grinding markets.
Long-Term Summary (2005-2026)
Over the full 21-year period, the Core Revised strategy achieved a monthly return of +1.05% with a PF of 1.62. This resulted in a maximum drawdown of -24.1% while using only 25% of the total capital. For comparison, a simple Buy and Hold strategy on SPY yielded a +0.72% monthly return with a significantly higher drawdown of -56.5%. If you prefer lower risk, the conservative version of this strategy achieves a monthly return of +0.79% with a PF of 1.59 and a reduced drawdown of -16.8%.
Verdict
This strategy involves buying when RSI(2) is below 10 while the price is above the 200-day SMA, using a -2% limit order, and selling upon recovery to the 5-day SMA. It is a genuine stock swing edge that has functioned for 21 years. There are two important caveats. First, the 100-stock universe is based on 2026 large-cap constituents, so there is some survivorship bias; rely on the relative performance against SPY and the null models rather than the raw absolute returns. Second, the data is unadjusted for dividends, which makes the Buy and Hold benchmarks look slightly worse than they are. This model is now a confirmed component of my stock research track. Whether to deploy it is a personal decision, but the strategy demonstrates that disciplined entry and capital allocation are the real engines of performance.