
One change to limit orders doubled the profit per trade
Refining the stock swing MR core strategy has revealed that the only meaningful improvement comes from changing the entry to a limit order set at…
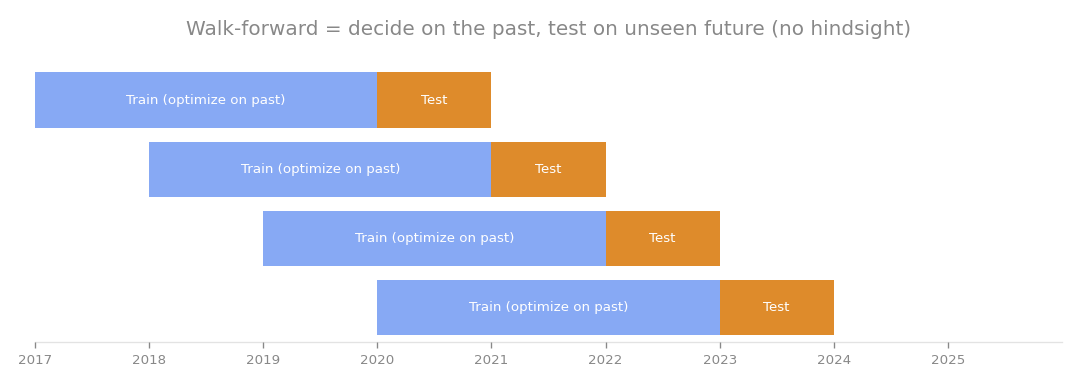
Walk-forward testing: decide the rules on the past, then test on unseen future data (no hindsight).
Refining the stock swing MR core strategy has revealed that the only meaningful improvement comes from changing the entry to a limit order set at -2%. By shifting away from market orders, the quality of each trade improved significantly, moving from an average of +73bp to +165bp. This version, which I call the “MR Core Revised,” delivers an OOS (out-of-sample) monthly return of +3.26% with a PF (profit factor) of 2.77 and a maximum drawdown of -8.19%.
The search for the sweet spot
My baseline was the previous MR core strategy, which used RSI(2) < 10 while above the SMA200 to trigger a buy and exited when the price closed above the SMA5. To improve this, I tested various adjustments to entry, exit, filters, and thresholds. The most successful change was replacing the market entry with a limit order placed at a specific discount from the previous day’s close. Testing at -0.5%, -1%, -2%, and -3% showed a clear plateau structure, confirming this wasn’t just a statistical fluke.
| Limit Depth | OOS Avg Profit (bp) | PF | Investment Rate |
|---|---|---|---|
| -0.5% | 79 | 1.73 | 70% |
| -1.0% | 81 | 1.73 | - |
| -2.0% | 143 | 2.44 | 31% |
| -3.0% | 200 | 2.68 | - |
| While deeper limit orders improved the quality of individual trades, they also reduced the frequency of entries. I found the -2% mark to be the sweet spot. Other attempts to improve the system, such as changing exit rules, adding market breadth filters, or adjusting RSI thresholds, consistently failed to add value and often degraded performance. |
The revised strategy
By using limit orders, I freed up capital that was previously tied up in less efficient entries. I reallocated this by increasing the position size (f=15% with a maximum of 7 positions). The comparison between the baseline and the revised strategy highlights the impact of this change.
| Metric | Baseline (OOS) | MR Core Revised (OOS) |
|---|---|---|
| Monthly Return | +2.18% | +3.26% |
| PF | 1.65 | 2.77 |
| Drawdown | -9.62% | -8.19% |
| Sharpe Ratio | - | 2.49 |
| I also tested a more aggressive configuration (f=20% with a maximum of 5 positions), which pushed the monthly return to +4.05% with a PF of 2.80 and a drawdown of -9.49%. To ensure these results weren’t specific to a single asset, I ran a random universe test across 40 different stocks. The performance remained robust, showing no significant dependency on any single ticker. |
Important considerations
Before drawing any final conclusions, keep these limitations in mind:
- Opportunity dependency: During the IS (in-sample) period, signals were relatively rare. This means monthly returns can be uneven depending on market conditions.
- Execution model: This analysis assumes a limit order model where touching the daily low counts as a fill. This is a reasonable assumption for large-cap stocks at a -2% depth.
- Data constraints: The current analysis is limited to a 23-month panel. I strongly recommend re-evaluating these results against a longer timeframe before considering any real-world allocation. Ultimately, the best path forward is simple: move from market entries to a -2% limit order. Trying to force additional exits, filters, or threshold changes only adds noise rather than performance.
How this connects
This verification builds on earlier ones (what failed before and what I tried this time, comparisons between approaches).