Same return as buy-and-hold with half the drawdown, no leverage
Removing prop-firm constraints and focusing on a 1:1 unleveraged cash portfolio reveals that Mean Reversion (MR) strategies can outperform a simple…
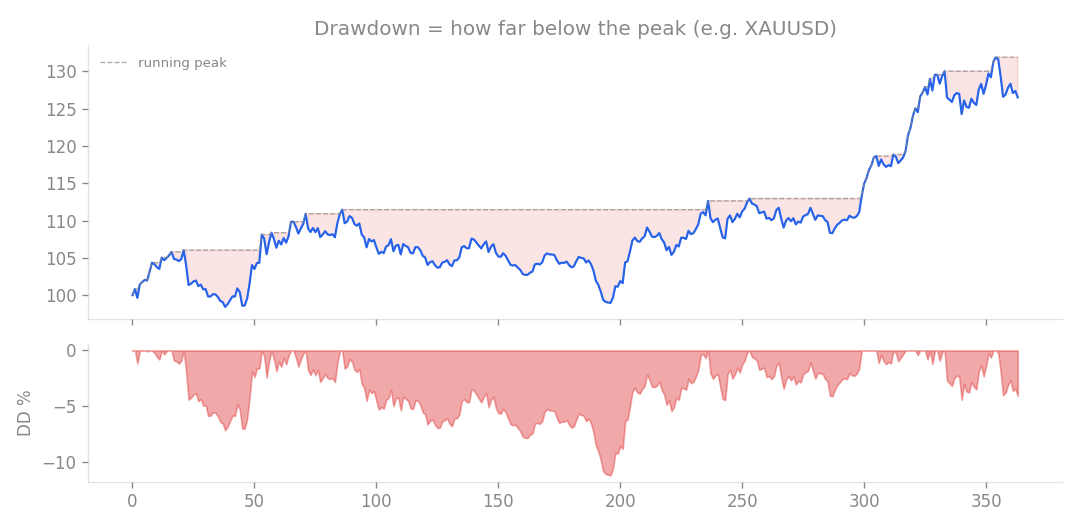
Drawdown = how far the account falls below its running peak (e.g. XAUUSD). The depth of this valley is what risk feels like.
Removing prop-firm constraints and focusing on a 1:1 unleveraged cash portfolio reveals that Mean Reversion (MR) strategies can outperform a simple buy-and-hold approach by significantly reducing risk. For this test, I shifted away from standard FX/metals/indices rules and instead capped total exposure at 100% to simulate a pure stock portfolio.
Portfolio Performance: MR Core vs. Equal-Weight Buy-and-Hold
The core strategy uses a setup of RSI(2) < 10 while above the 200-day SMA, exiting when the price recovers above the 5-day SMA. With a 10% position size per trade and a maximum of 10 positions across 104 daily-chart stocks, the results are clear.
| Metric | MR Core Strategy | EW Buy-and-Hold (Benchmark) |
|---|---|---|
| Monthly Return | +1.23% | +1.45% |
| Profit Factor | 1.64 | N/A |
| Max Drawdown | -9.62% | -19.91% |
| Sharpe Ratio | 1.25 | 1.07 |
| In other words, the strategy generates returns nearly on par with a simple buy-and-hold index, but it achieves this with less than half the drawdown. Because the average investment rate is only 37%, it leaves over 60% of your capital uncommitted, providing much higher capital efficiency. |
Structural Robustness
I tested different position sizing to see if the strategy holds up under varying degrees of concentration.
- Diversified (f=5% x 20 positions): Monthly return +0.88%, PF 1.72, and a drawdown of -5.71%. This offers the lowest risk profile.
- Concentrated (f=20% x 5 positions): Monthly return +1.39%, PF 1.61, and a drawdown of -11.00%. The relationship between return and drawdown is consistent and predictable. This suggests the strategy is structurally sound, as it does not break down when you adjust the leverage intensity.
Why the 200-Day SMA Filter is Non-Negotiable
It is a common trap to look at aggregate stats for all stocks and assume the strategy works everywhere. When I removed the 200-day SMA filter, the portfolio collapsed entirely. It produced a monthly return of -0.92%, a PF of 0.92, and a drawdown of -26.5% while consuming 86% of the available capital. This happens because without the filter, the strategy essentially tries to catch falling knives during major market crashes, repeatedly buying into stocks that are in a structural downtrend. This serves as a reminder that aggregate pool statistics can be misleading; the portfolio’s behavior in a live, multi-asset environment is what actually matters.
Verdict
This MR core setup (using RSI(2) < 10, a 200-day SMA filter, and a 5-day SMA exit) is a viable way to manage a 1:1 cash portfolio. It is best viewed not as a high-octane return generator but as a low-drawdown alternative to a buy-and-hold strategy. While the results are encouraging, keep in mind the limitations of this test: the data covers a 23-month period that was largely a bull market, and the universe of stocks leans toward mega-caps, which may introduce survivor bias. I have left the door open for a re-evaluation using longer-term daily chart data in the future.
How this connects
This verification builds on earlier ones (what failed before and what I tried this time, comparisons between approaches).