26 stock day-trade ideas, all dead on unseen data
Seeking a robust technical edge for intraday stock trading, I recently put 26 different hypotheses to the test.
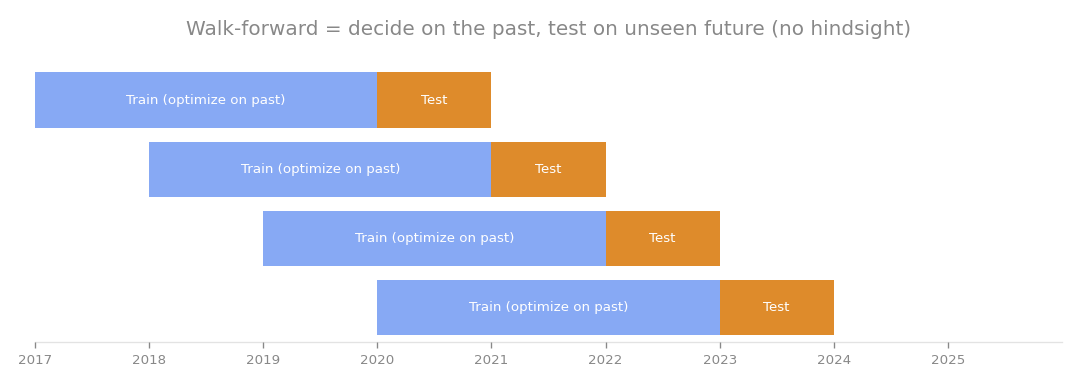
Walk-forward testing: decide the rules on the past, then test on unseen future data (no hindsight).
Seeking a robust technical edge for intraday stock trading, I recently put 26 different hypotheses to the test. The results were clear: there is no reliable, repeatable edge in “open-to-close” day trading strategies using daily data.
The Testing Framework
I focused on a “buy at open, sell at close” model. Because I only have access to daily OHLC (open, high, low, close) data, this approach ensures the calculations are exact. I used a panel of 105 stocks over 486 trading days (July 2024 to June 2026). To ensure data integrity, I implemented a strict filter to reject poor-quality data, such as entries with zero volume or weekend bars. After cleaning, 104 stocks remained. I split the testing into an In-Sample (IS) period ending in September 2025 and an Out-of-Sample (OOS) period thereafter, further validating the results against a “random universe” of synthetic portfolios.
From In-Sample Success to Out-of-Sample Failure
During the IS phase, six hypotheses passed my quality gates. These required at least 100 trades, a net t-score of 2.0 or higher, and a PF (profit factor: gross profit divided by gross loss) of 1.15 or better. The strongest performer was a “big down 3% fade” strategy, which looked for stocks that dropped 3% the previous day and bought them at the open to sell at the close. It showed a strong PF of 1.40. However, when I moved to the OOS period, every single one of these strategies collapsed.
| Strategy | IS Performance (t-score) | OOS Performance (t-score) |
|---|---|---|
| Big Down 3% Fade (Long) | +37.4bp (t=4.68) | +4.8bp (t=0.62) |
| Open < Prev Low Fade (Long) | +24.5bp (t=3.63) | -1.2bp (t=-0.21) |
| Gap Up 2% Fade (Short) | +18.2bp (t=2.92) | -2.9bp (t=-0.48) |
| In other words, the “edge” I found was nothing more than curve-fitting to historical noise. The strategies that looked profitable in the past failed to generate any meaningful return when tested on new data. |
Why Intraday Trading Struggles
The structural reason for this failure lies in where the market’s returns actually live. When I analyzed the data, I found that the “intraday drift” (open-to-close) was statistically significant in the IS period, but vanished entirely in the OOS period. Conversely, the “overnight drift” (previous close to current open) remained consistently positive and statistically significant across both periods. By forcing a strategy to trade only during the day, I was essentially cutting out the only stable source of return and fighting against a persistent lack of intraday edge. Furthermore, once you account for trading costs (estimated here at a 2-cent spread plus 2bp), any minor, fleeting edges are wiped out completely.
Verdict
There is no robust technical edge in “open-to-close” stock day trading that can be verified using daily data. The strategies that appear profitable in backtests are simply products of regime-specific noise. If you want to pursue intraday trading, you must move beyond daily data and account for the structural disadvantage of excluding the overnight period, where the real market momentum resides.
How this connects
This verification builds on earlier ones (what failed before and what I tried this time, comparisons between approaches).