Break-even stops helped exactly one sleeve out of seven
I have spent considerable time researching ways to improve trade exits, specifically by trying to reduce "giveback", the phenomenon where a trade…
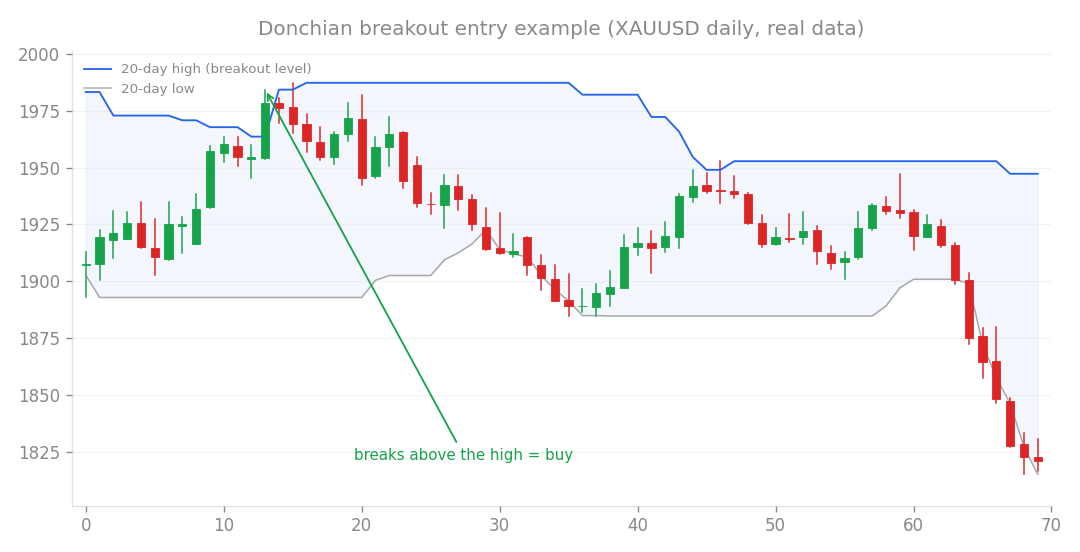
Breakout entry example (XAUUSD daily, real data): buy when price breaks above the recent high.
Refining the exit: Why protecting paper profits usually backfires
I have spent considerable time researching ways to improve trade exits, specifically by trying to reduce “giveback”, the phenomenon where a trade sits in profit but eventually hits the stop loss. My past research into fixed take-profits, scaling out, and momentum decay all ended in rejection. This time, I tested two specific “profit protection” mechanisms on all my strategy sleeves:
- BE (Break Even): If an unrealized profit reaches a certain multiple of the initial stop-loss distance (R), move the stop loss to the entry price.
- LOCK: If profit exceeds a trigger level, lock in a percentage of that profit using a trailing stop. I implemented these as simple stop-loss adjustments, ensuring they are compatible with standard EA logic without looking ahead at future price data.
The reality of trade giveback
My first step was to verify if the problem actually exists. I measured the MFE (Maximum Favorable Excursion), which tracks the peak profit a trade reaches before closing.
- Trend-following strategies: The “giveback” is real. In my
trend_H1strategy, 20% of losing trades (170 out of 840) reached at least +1R of profit before failing. The numbers were even higher for Gold (29%) and indices (41%). - Mean reversion / time-based exits: These barely show any giveback (0% to 0.4%). Because these systems exit quickly by design, there is structurally very little profit to give back.
Why most interventions fail
While it seems intuitive to protect these gains, cutting a trade early often damages the system’s ability to capture the “tail”: the rare, large winners that drive overall performance. For most of my strategies, applying BE or LOCK mechanisms resulted in stagnant or declining monthly returns and worse out-of-sample (OOS) performance. Even when the win rate rose slightly, the cost of cutting winners short meant the system could not recover the lost potential, even with increased trade frequency.
The exception: sat2
The sat2 sleeve was the only one that benefited from this logic. Because its structural stop loss (placed at recent pivot lows) is relatively wide and trades often last several days, moving the stop to break even provides a genuine safety net.
| Metric | BASE (No BE) | BE 1.0R |
|---|---|---|
| Profit Factor (PF) | 1.62 | 1.78 |
| Monthly Return | +0.318% | +0.341% |
| Drawdown (DD) | -6.57% | -5.38% |
| OOS Return (2023-) | +17.4% | +17.9% |
| PF is the ratio of gross profit to gross loss, where a value over 1.0 indicates a profitable system. |
System-wide impact
Applying the BE 1.0R setting to sat2 improved the entire portfolio. By tightening the stop loss toward the entry price, I improved the overall robustness of the system without introducing new risks.
- Portfolio Impact: Overall monthly return increased from +0.814% to +0.840%, while the drawdown decreased from -8.36% to -7.02%.
- Monte Carlo (MC) Pass Rate: The probability of passing prop-firm style stress tests improved, with the failure rate dropping from 0.9% to 0.6%.
Verdict: After testing every major exit variation, the answer for 6 out of 7 strategies is “No”. Giveback is simply the structural cost of capturing large winners. However, for
sat2, the answer is a clear “Yes.” I have implemented the BE 1.0R logic into the current system, resulting in a 3.2% increase in combined monthly returns and a meaningful reduction in drawdown.
Code to reproduce
You can reproduce this with the following scripts (see repo).
strategies/yosuga_dow.py