
Rotation does not earn, but as a shield it is real
Adding a tactical rotation layer to a portfolio of randomly selected large-cap stocks does not generate excess returns, but it acts as a genuine…
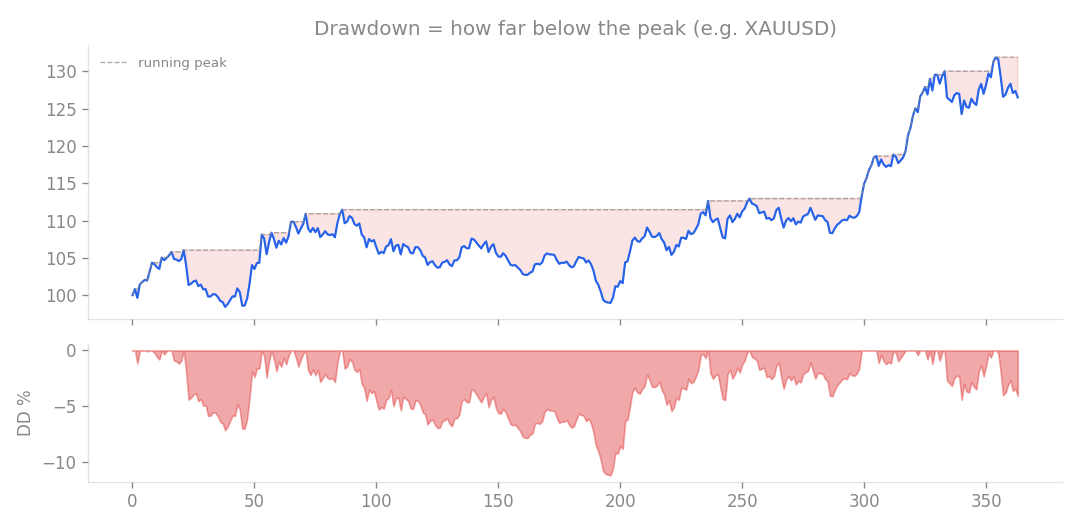
Drawdown = how far the account falls below its running peak (e.g. XAUUSD). The depth of this valley is what risk feels like.
Adding a tactical rotation layer to a portfolio of randomly selected large-cap stocks does not generate excess returns, but it acts as a genuine defensive shield during market crashes. I tested a rotation strategy using 56 large-cap stocks that were listed prior to 2010. To avoid the bias of picking only current winners, I ran 40 simulations where I randomly selected 11 stocks for each run. The strategy used a 63-day momentum filter, a 200-day moving average, a top-4 selection rule, and a regime filter that shifts capital to IEF (Treasury bonds) during market stress. I evaluated the strategy against two timeframes: a 15-year window starting in 2011 and an extended window starting in 2003 that includes the Global Financial Crisis (GFC).
Performance Comparison
| Metric (Median) | Strategy (15y) | EW Buy/Hold (15y) | Strategy (Extended) | EW Buy/Hold (Extended) |
|---|---|---|---|---|
| CAGR | 18.2% | 17.6% | 17.5% | 15.5% |
| Monthly Return | 1.41% | 1.36% | 1.35% | 1.21% |
| PF | 2.25 | - | 2.14 | - |
| MDD | -31.6% | -38.3% | -32.3% | -53.1% |
| Sharpe Ratio | 1.02 | 0.93 | 0.95 | 0.79 |
| Note: EW = Equally Weighted. PF (Profit Factor) is gross profit divided by gross loss; a value above 1 indicates a profitable system. MDD = Maximum Drawdown, representing the peak-to-trough decline. |
The Verdict
The results clarify what this logic actually does for a portfolio. First, as an alpha generator (a way to boost returns), the answer is no. In 23 out of 40 cases, the strategy performed no better than simply holding the same 11 stocks equally. In other words, the strategy’s return is statistically indistinguishable from a coin flip against a buy-and-hold approach. The high returns seen in previous tests were likely a result of “survivorship bias” in the selected stock universe rather than the logic itself. Second, as a defensive device, the answer is yes. The logic excels at softening the blow during market collapses. In the extended window including the GFC, the strategy cut the median drawdown nearly in half, from -53.1% to -32.3%. It improved the Sharpe ratio (a measure of risk-adjusted return) in 37 out of 40 cases. This confirms why my previous tests with sector ETFs failed: ETFs are highly correlated, leaving no room for the momentum filter to find meaningful dispersion between assets. Individual stocks provide the necessary variety to make the rotation work. However, since my current research track already includes similar defensive overlays, I will not be adopting this specific rotation logic. It remains a solid tool for long-term individual equity management, but it is a risk-management overlay rather than a profit engine.
How this connects
This verification builds on earlier ones (what failed before and what I tried this time, comparisons between approaches).