I got greedy with the profit factor. Walk-forward said no
Adding the "ADX rising" filter to my TJL gold strategy failed to improve long-term performance.
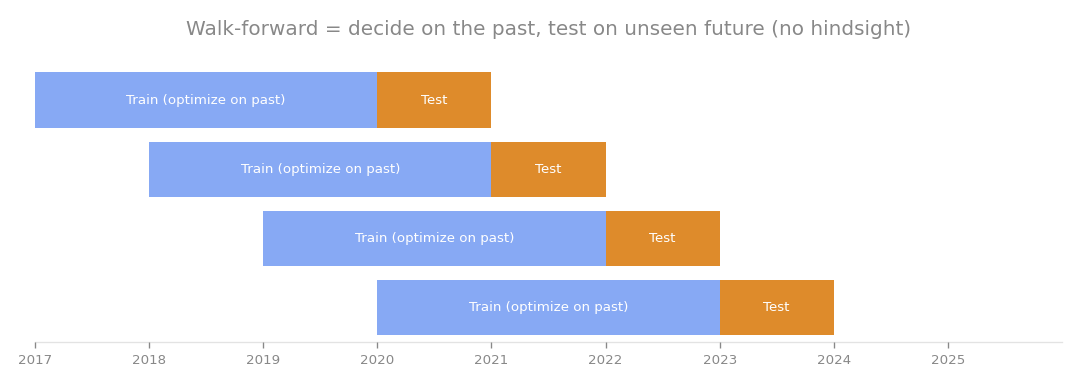
Walk-forward testing: decide the rules on the past, then test on unseen future data (no hindsight).
Adding the “ADX rising” filter to my TJL gold strategy failed to improve long-term performance. This confirms that I have reached the limit of adding entry constraints. My current baseline remains the ER0.3 (Efficiency Ratio) and ADX20 filter setup. This configuration holds positions for 5 bars and delivers a profit factor (PF) of 2.46 with 97 trades. When adding a 2-ATR stop-loss, the PF improves to 2.54. In other words, the strategy is consistently profitable. I will be keeping version 1.9.0 of the EA exactly as it is.
The search for new filters
I tested five potential filters to see if I could refine the entries further. My criteria for adoption were strict: the strategy had to show a higher PF across the full period and in both the first and second halves of the out-of-sample (OOS) data while maintaining at least 60 trades.
| Filter | Result |
|---|---|
| Signal bar quality | Degraded (PF 1.99 to 2.12) |
| Weekly SMA alignment | Marginal difference (PF 2.39 to 2.48) |
| Structural exit (low of previous day) | Degraded (PF 1.86) |
| Level breakout (previous high at resistance) | PF 3.57 to 11.63 (Too few trades: 13 to 17 over 11 years) |
| ADX rising | Passed (PF 2.88) |
| The “level breakout” filter produced spectacular PF numbers, but it failed the volume test. With only 13 to 17 trades over 11 years, it only added about 0.05% to 0.06% to the monthly return. While it is too infrequent to use as a primary filter, it is clean enough that I am keeping it in my notes as a potential future “booster” for high-conviction trades. |
Why ADX rising failed the final exam
The “ADX rising” filter looked promising at first. It passed my initial screening with a PF of 2.88 and 77 trades. It looked even better when combined with a stop-loss (PF 3.00, 1.3% drawdown, and a Sharpe ratio of 1.24). However, it failed the Walk-Forward (WF) final exam. I ran a grid of 32 configurations across seven different time windows. While the training phase results looked impressive, the linked OOS performance actually dropped. The version with the “rising” filter yielded a PF of 2.10 and a monthly return of 0.235%. This is worse than the baseline version without the filter (PF 2.37, 0.265% monthly return). In other words, the added complexity created more variance than signal. The performance boost I saw in the static test was likely just the result of a small sample size and the fact that ADX was already at 20. This is a classic case of overfitting: the model learns the noise of the past rather than the underlying market mechanics.
Moving forward
I have reached the “noise floor” for this strategy. Adding further entry conditions to a dataset of roughly 77 to 97 trades is no longer statistically sound. To continue improving, I need to look in different directions:
- Scaling: Testing the TJL definition on silver (XAGUSD) or stock indices to see if this edge holds across other assets.
- Selective boosting: Managing the “level breakout” logic as a separate, infrequent signal for special occasions.
- Capital management: Focusing on risk and leverage rather than trying to squeeze more out of the entry logic.
How this connects
This verification builds on earlier ones (what failed before and what I tried this time, comparisons between approaches).