The new sleeve passed its final exam: seven winning years out of seven
The TJL-gold strategy using ER (Efficiency Ratio) and ADX filters has officially passed its final evaluation, confirming its place as a viable…
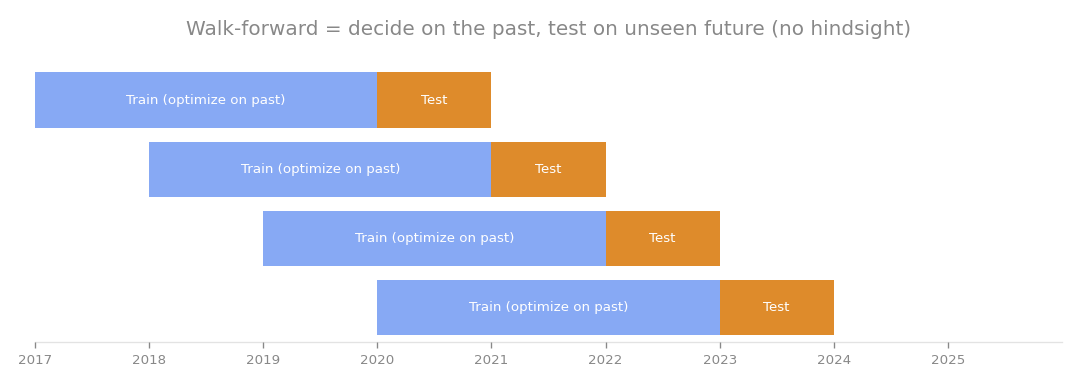
Walk-forward testing: decide the rules on the past, then test on unseen future data (no hindsight).
The TJL-gold strategy using ER (Efficiency Ratio) and ADX filters has officially passed its final evaluation, confirming its place as a viable addition to my core trading portfolio.
Validating the filters with a Walk-Forward approach
To ensure the strategy wasn’t just lucky, I used a Walk-Forward (WF) test. This involves training the model on three years of data, testing it on the following year, and then shifting the window forward repeatedly. Over seven windows from 2019 to 2026, the strategy remained profitable every single year.
| Metric | Result |
|---|---|
| Combined OOS PF | 2.37 |
| Total Trades | 82 |
| Win Rate | 53.7% |
| The results show a PF (profit factor, or gross profit divided by gross loss) of 2.37. This means that for every dollar lost, the strategy gained $2.37. Crucially, the model chose to use both the ER and ADX filters in every one of those seven years. This suggests that the edge provided by these filters is genuine rather than a result of selection bias. | |
| However, there is a trade-off. A baseline version without these filters produced a higher total return (+35.9% compared to +23.3%) and more trades, but with a lower PF of 2.03. In other words, the filters act as a quality control mechanism, sacrificing volume and raw return to significantly improve the consistency of the trades. |
Portfolio integration and impact
I tested how this strategy performs when added to my existing core system. Because the daily correlation between the TJL-gold strategy and my full core system is only +0.14, it acts as a genuine diversifier. It does not simply mirror what the other sleeves are doing.
| Configuration | Monthly Return | PF | Max DD | Return/DD Ratio |
|---|---|---|---|---|
| Core System Only | +0.84% | 1.64 | -8.4% | 0.101 |
| Core + TJL (0.0025 risk) | +0.88% | 1.66 | -8.1% | 0.109 |
| Core + TJL (0.005 risk + SL2) | +0.88% | 1.66 | -8.0% | 0.109 |
| Across all configurations, adding this strategy improved the monthly return relative to the drawdown (DD). The best results were found using either the 0.0025 risk setting or the 0.005 risk setting with a tight stop-loss (SL2), both providing an 8% improvement in the return-to-drawdown ratio. |
Final verdict
The TJL-gold strategy is a rare exception to my previous findings that technical indicators on price data had been fully exhausted. It seems that by porting a day-trading method from the stock market to gold, I managed to capture an edge that hadn’t been fully explored. I am moving this to the implementation phase. The remaining work involves coding the seventh sleeve into MQL5, conducting a stress test of the M1 intraday risk, and monitoring its forward performance. While the 8% improvement is solid, whether that justifies the development effort is a decision each trader must make for their own setup.
How this connects
This verification builds on earlier ones (what failed before and what I tried this time, comparisons between approaches).