Two filters took the profit factor from 1.80 to 2.46
Adding a dual trend filter to the TjlBreakout strategy for gold (XAUUSD) has successfully raised the profit factor from 1.80 to 2.46.
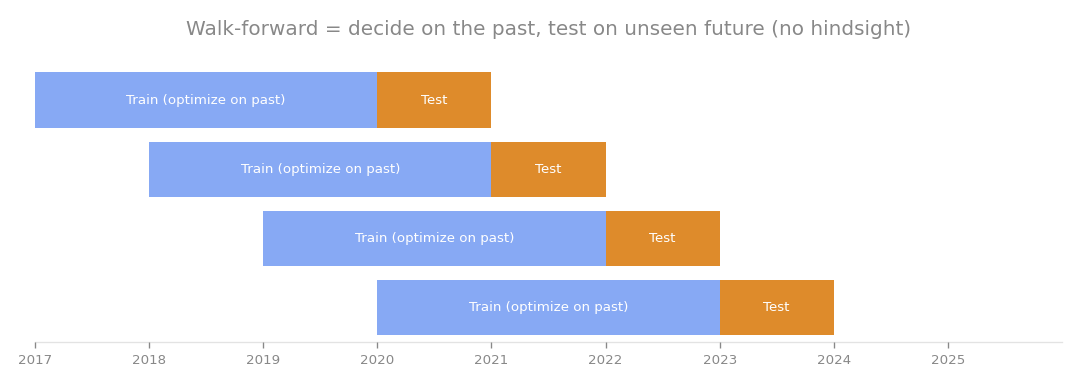
Walk-forward testing: decide the rules on the past, then test on unseen future data (no hindsight).
Adding a dual trend filter to the TjlBreakout strategy for gold (XAUUSD) has successfully raised the profit factor from 1.80 to 2.46. By incorporating a stop-loss, the profit factor climbed further to 2.54. The base strategy from my previous research was a breakout system on the daily timeframe with 215 trades. To improve it, I set a strict rule: any modification must increase the profit factor across the entire period, improve performance in both the out-of-sample (2016-2021) and in-sample (2021-2026) periods, and maintain at least 100 trades over the 11-year span.
Screening individual filters
I tested 15 different filters to see which could refine the entry criteria. Most failed. For example, RSI-based overbought filters actually hurt the profit factor. This suggests that for a breakout strategy, high momentum is a positive signal rather than a warning sign. Similarly, moving average deviation filters reduced the trade count too drastically, and adjusting the holding period beyond five days led to diminishing returns. Only two filters passed the screening:
| Filter | Profit Factor (Total) | OOS (2016-2021) | IS (2021-2026) |
|---|---|---|---|
| ER10 ≥ 0.3 | 2.04 | 1.53 | 2.62 |
| ADX14 ≥ 20 | 2.10 | 1.46 | 3.03 |
| ER (Efficiency Ratio) measures the trend strength relative to noise. PF (Profit Factor) is gross profit divided by gross loss; any value above 1.0 is profitable. |
Combining filters for stability
By combining the Efficiency Ratio and ADX filters, the performance metrics improved significantly. In other words, the strategy now focuses on breaking out only when the market is both efficient and trending strongly.
| Metric | Base Strategy | Combined Filters | Combined + 2ATR SL |
|---|---|---|---|
| Profit Factor | 1.80 | 2.46 | 2.54 |
| Monthly Return | - | +0.21% | +0.11% |
| Drawdown | - | -3.7% | -1.3% |
| Sharpe Ratio | - | 1.05 | 1.17 |
| OOS / IS PF | 1.35 / 2.29 | 1.84 / 3.30 | - |
| The risk-adjusted return (calculated as monthly return divided by drawdown) improved to 0.085, which is 1.9 times better than the base strategy. Furthermore, the daily correlation with my existing gold breakout strategy dropped from 0.53 to 0.43, indicating that these filters are successfully isolating a unique market cross-section. |
Verdict and next steps
The profit factor improvement is consistent across both test periods, and the results are stable; small changes to the filter thresholds do not cause the strategy to collapse. The underlying edge seems to be that breakouts following a period of efficient, strong trends tend to carry momentum for several days. However, I am not adopting this as a standalone strategy yet. With only 97 trades, the statistical power is relatively low, and the risk of selection bias remains after testing 25 different configurations. If I were to move forward, the next requirements are a rigorous walk-forward validation and a core-integration test to ensure that adding this to my portfolio does not create excessive concentration risk in gold.
How this connects
This verification builds on earlier ones (what failed before and what I tried this time, comparisons between approaches).