
Porting the winning logic to USD pairs: what survived
Applying the trend-following logic that works for JPY crosses to USD-based pairs is ineffective.
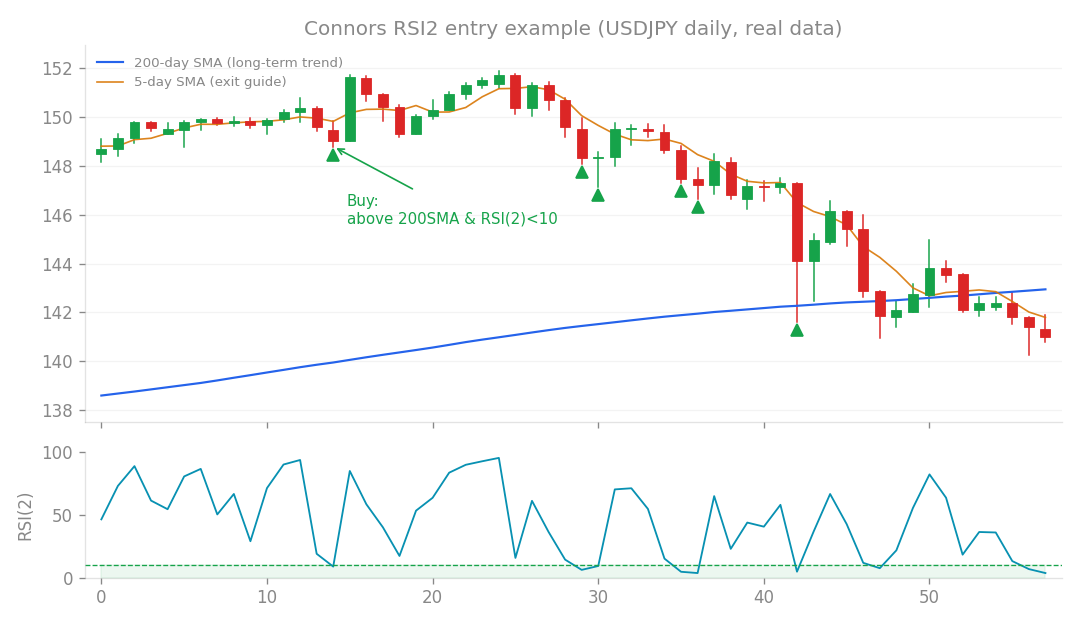
Connors RSI2 entry example (USDJPY daily, real data): buy the dip when price is above the 200-day SMA and RSI(2) falls below 10.
Applying the trend-following logic that works for JPY crosses to USD-based pairs is ineffective. My research shows that the edge in my original system relies entirely on the specific beta of the Japanese Yen rather than the underlying logic itself.
The Failure of Trend-Following on USD Pairs
I tested a direct port of my trend-following logic (MTF H1/H4/D1 breakout with a D1 filter) onto four USD pairs. The results were clear: while the JPY-based system (using USDJPY, CHFJPY, EURJPY, and GBPJPY) achieved a Profit Factor (PF) of 1.49 with a monthly return of +0.586%, the USD-based equivalent failed across the board.
| Metric | JPY Crosses (OOS) | USD Pairs (OOS) |
|---|---|---|
| Profit Factor | 1.49 | 0.88 |
| Monthly Return | +0.586% | -0.147% |
| Drawdown | -11.0% | -18.0% |
| In other words, the JPY-based system was simply riding the persistent JPY depreciation trend. When applied to USD pairs, which lack that specific directional bias, the strategy collapsed into a series of losses. Attempting to fix this by adding short positions (symmetric breakout) only worsened the outcome, resulting in a PF of 0.84 and a drawdown of -64.7%. |
The Connors-LS Alternative
The only viable edge I found for USD pairs is a mean-reversion strategy using the Connors RSI(2). Unlike the breakout logic, the Long-Short (LS) version of this strategy proved robust, maintaining consistent performance between the In-Sample (IS) and Out-of-Sample (OOS) periods.
- OOS Performance: PF 1.39, Sharpe ratio 0.64, Drawdown -3.3%, Win rate 66%.
- Robustness: Using a leave-one-out test (removing one pair at a time), the PF remained above 1.1 for all combinations. This confirms the strategy is not dependent on any single currency pair. However, this is not a standalone system. With a Monte Carlo pass rate of only 1.8% for the full test, it lacks the frequency and return profile to be operated alone. It is, however, highly effective as a diversification tool.
Diversification Impact
When I added this USD-based Connors-LS sleeve to my existing Core System (v1.5.0), the results were compelling. Because the daily correlation between the two systems is extremely low (+0.012), the addition acts as a genuine “diversifier.”
- Risk Management: While the monthly return saw only a marginal increase (from +0.814% to +0.837%), the system-wide drawdown decreased from -8.36% to -7.74%.
- Verdict: The conversion to USD pairs only works if you shift from a trend-following model to a mean-reversion (Connors-LS) model. You cannot simply swap symbols.
The value here lies not in chasing higher returns but in reducing drawdown. By lowering the system’s overall risk profile, I can potentially increase leverage to improve monthly returns while staying within my original drawdown budget. Moving forward, I need to design an MT5 implementation that specifically enables short-selling for these pairs because my current
SleeveConnorsis limited to long-only positions.
How this connects
This verification builds on earlier ones (what failed before and what I tried this time, comparisons between approaches).