
An adversarial audit of my own upgrades erased half of them
The attempt to improve my existing dynamic risk control system using a "DD/Volatility Governor" has failed.
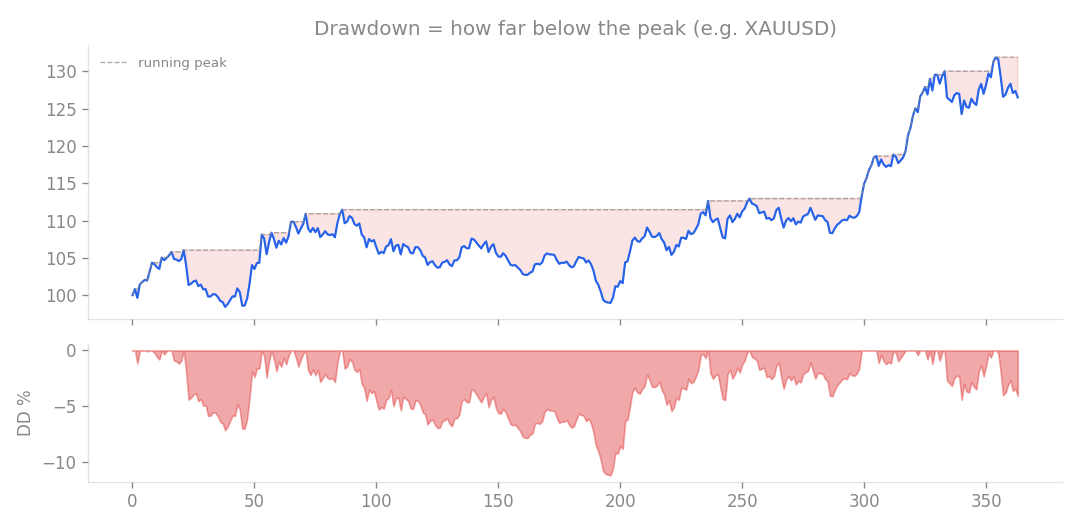
Drawdown = how far the account falls below its running peak (e.g. XAUUSD). The depth of this valley is what risk feels like.
The attempt to improve my existing dynamic risk control system using a “DD/Volatility Governor” has failed. The goal was to build a system that scales risk down during high-volatility or drawdown periods to allow for a higher base leverage cap (k_cap 2.0 to 3.0). However, the governor proved to be an ineffective throttle. While it did suppress blow-up rates to 1.2% at a k_cap of 2.0, it significantly dragged down monthly returns from 0.92% to between 0.56% and 0.62%. In other words, the cost of protection was too high, and the system failed to outperform the current standard of k_cap 1.5, which yields 0.92% monthly with a 0% blow-up rate. The worst single-day loss of -3.22% remains unpredictable. Since no governor could account for this, I have concluded there is no “free lunch” here. The k_cap of 1.5 remains the best balance. I also conducted an adversarial audit using four parallel agents to verify the integrity of my recent research and the MT5 v1.7.0 implementation.
Audit Findings
| Metric | Result | Note |
|---|---|---|
| System Integrity | Verified | The core logic (v1.5.0) was perfectly reproduced. |
| MT5 v1.7.0 | Compatible | Logic is algebraically identical to the Python model. |
| Bug Fix (146) | Corrected | Previous blow-up rates for high-k settings were underestimated. |
| “Knife-Edge” Risk | Critical | The current 0% blow-up rate is highly sensitive to small data shifts. |
| The most important takeaway from this audit is that my reported “0% blow-up rate” is a structural byproduct of the specific 11-year dataset I use. Because my current setup sees a worst daily loss of -3.22%, it sits just 0.17 points away from the -5% limit that triggers a failure. This is a “knife-edge” scenario. If I replace just one day in the simulation with a -3.5% loss, the blow-up rate jumps to 15.4%. If volatility increases by 20%, it hits 28.5%. | ||
| Furthermore, I have not yet fully verified intraday safety. My current limits are based on end-of-day data, but if the true intraday worst-case loss is 1.2 times the end-of-day figure, then -3.87% is the real exposure. In that scenario, a k_cap of 1.5 would already be in breach of safety limits. |
Final Verdict and Action Plan
The structural claim that boundary-aware risk shaping dominates fixed-risk strategies remains valid. However, the absolute figures I have been working with are overly optimistic. The strategy is not as robust as the 0% blow-up rate suggests. Moving forward, I am implementing the following changes:
- Lower the risk cap: I am reducing the recommended k_cap from 1.5 to a more conservative 1.2 to 1.3 to provide a safety margin against the “knife-edge” volatility I discovered.
- M1 stress testing: I will perform a full measurement of the worst-case intraday loss using 1-minute (M1) data across all sub-strategies before finalizing the new leverage cap.
- Confirm drawdown rules: I need to verify with the prop firm whether their -10% limit is static or trailing. If it is trailing, the monthly returns would drop from 0.92% to 0.33%, which changes the viability of the entire system. Until these measurements are complete, I am keeping the system in a conservative state, either disabling dynamic leverage or capping it at 1.3.
How this connects
This verification builds on earlier ones (what failed before and what I tried this time, comparisons between approaches).