How fast can a personal account grow if you accept 50% drawdowns?
If you move from a prop firm environment to a personal trading account, the removal of strict constraints such as daily loss limits or maximum…
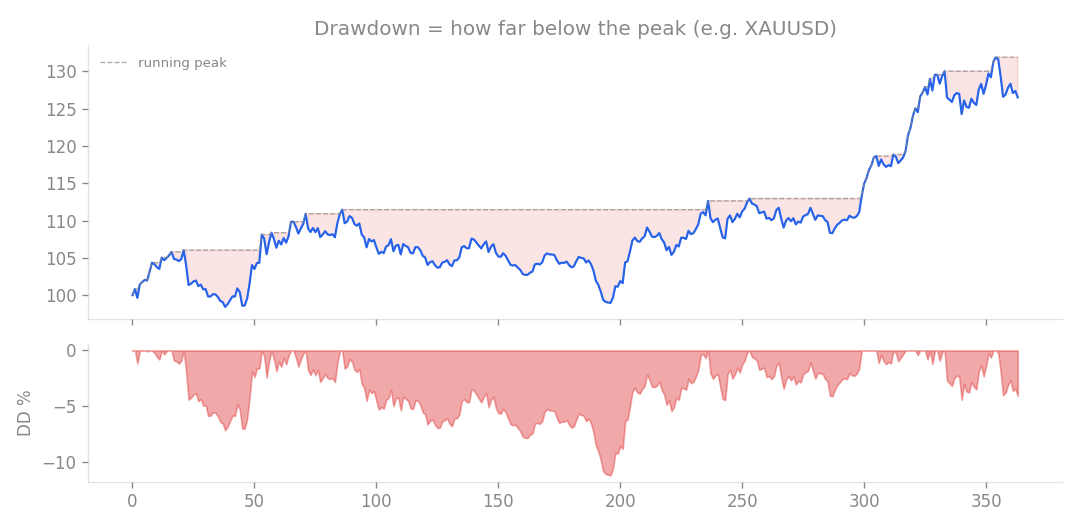
Drawdown = how far the account falls below its running peak (e.g. XAUUSD). The depth of this valley is what risk feels like.
If you move from a prop firm environment to a personal trading account, the removal of strict constraints such as daily loss limits or maximum drawdown caps allows you to fundamentally rethink how you scale your risk. I wanted to quantify exactly what happens when you shift from a restrictive environment to one where you are willing to tolerate a maximum drawdown (DD) of 50%, which represents the peak-to-trough decline in account equity. Using my v1.5.0 system as a baseline, I tested the impact of scaling the risk by a factor of “k.” By applying block bootstrap Monte Carlo simulations, a method that reshuffles historical return data to project potential future performance, I measured how much return you can realistically extract when you stop playing defense and start scaling.
Performance comparison by risk multiplier (k)
| Multiplier (k) | Monthly Return | Annualized Return | Realized Max DD | MC 95% Worst DD |
|---|---|---|---|---|
| 1 (Base) | 0.90% | 11.4% | -9.1% | - |
| 3 | 2.58% | 35.8% | -26.8% | -40.3% |
| 4 | 3.37% | 48.8% | -35.1% | -50.4% |
| 5 | 4.11% | 62.1% | -43.1% | -59.1% |
| 6 | 4.81% | 75.7% | -50.5% | - |
| In all scenarios, the Profit Factor (PF), which is the ratio of gross profit to gross loss, remains stable at 1.64. This confirms that the edge of the system itself does not change. You are simply choosing to harvest more of that edge by increasing your risk exposure. |
Finding your scaling limit
When you allow for a 50% drawdown, there are two ways to interpret the data, depending on how much “worst-case” protection you want to build in. The aggressive approach (k=5) If you judge your success based on realized past performance, a multiplier of k=5 keeps your drawdown within the 50% limit (at -43.1%). This nets you a monthly return of 4.11% and an annual return of 62.1%. In other words, this is the maximum output you can reasonably expect if the future looks exactly like the past. The conservative approach (k=3) If you prefer to be safe against future volatility by using the Monte Carlo 95% worst-case estimate, you should aim for k=3. Here, your historical drawdown is a manageable -26.8%. Even if the future turns significantly uglier, the simulation suggests your drawdown would likely stay around -40.3%. This is well within your 50% tolerance while still providing a solid 2.58% monthly return. Ultimately, while the potential for higher returns is tempting, a 50% drawdown is brutal. It requires a 100% gain just to break even, which can take years of recovery time. Because of this, I recommend the k=3 conservative path. It effectively captures the benefits of a less restrictive personal account without pushing the system to a breaking point where a single bad streak could permanently sideline your capital.
How this connects
This verification builds on earlier ones (what failed before and what I tried this time, comparisons between approaches).