The 80% win-rate method tested out at 48.5%
The strategy famously marketed as having an 80% win rate by the online figure "Fiana" failed to demonstrate any robust edge in my testing.
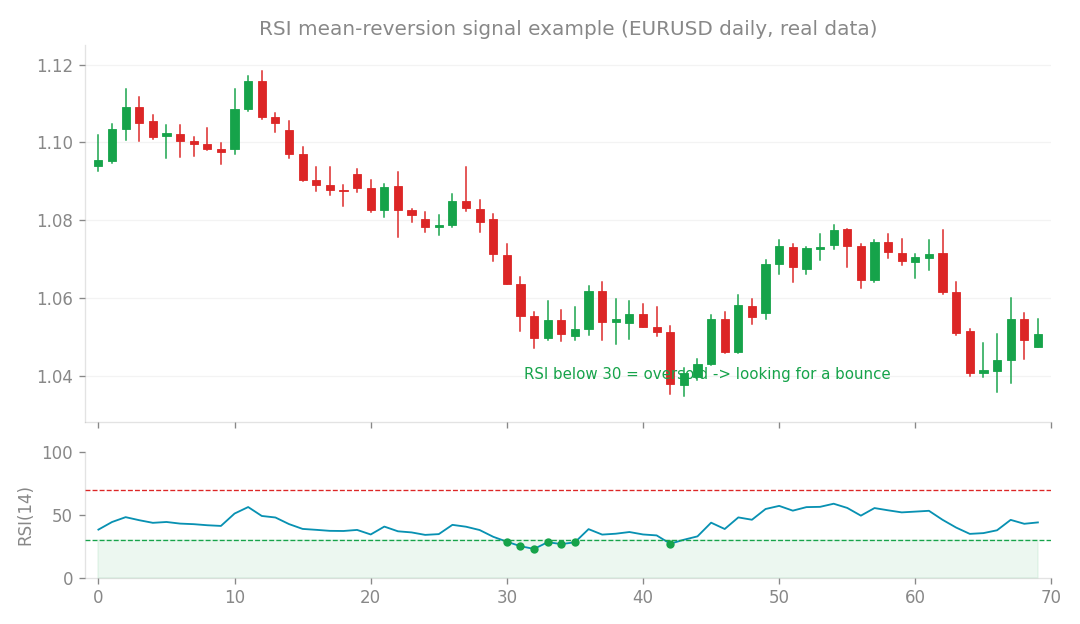
Mean-reversion (RSI) signal example (EURUSD daily, real data): look for a bounce when RSI is oversold.
The strategy famously marketed as having an 80% win rate by the online figure “Fiana” failed to demonstrate any robust edge in my testing. After reconstructing the logic from available notes and running it through a rigorous out-of-sample (OOS) verification, the results suggest that the claimed performance is mathematically inconsistent with market reality.
The Methodology
I tested the strategy using a multi-timeframe approach: entries occur on the H1 chart when price breaks the 20-period EMA, re-tests it, and closes back in the direction of the H4 20-period EMA. I set the stop loss (SL) at the recent swing high or low, with a take profit (TP) at a 1:1 ratio. I ran this across 10 major currency pairs and gold using data from 2015 to 2025, testing 14 different variations of the logic.
Results Comparison
All 14 variations failed to meet the criteria for a profitable strategy in the OOS period (2020 to 2025).
| Metric | Measured Result |
|---|---|
| Median Win Rate | 48.5% (across 9,636 trades) |
| Median Profit Factor (PF) | 0.85 to 0.97 |
| Monte Carlo Pass Rate | 16% (for the best-performing pair) |
| In other words, the strategy performs like a coin flip after accounting for trading costs. The “80% win rate” claim is not supported by the data; adjusting the risk-reward ratio (RR) to force a higher win rate only drags the expected value further into negative territory. |
Analysis of the “Best” Performers
While some variations showed a positive return, they were entirely reliant on a single, unsustainable factor: concentration in JPY pairs during specific trends.
- The JPY Trap: Strategies that appeared profitable were simply capturing the “beta” of the Japanese Yen’s directional movement. While EURJPY or GBPJPY might show a positive net profit, the drawdown (DD) associated with these trades was catastrophic, often exceeding the account balance.
- Prop Firm Failure: Even the best-performing pair (EURJPY) achieved only a 16% pass rate under standard prop firm stress testing. The intraday volatility would disqualify a trader almost immediately.
- Consistency: Across 10 years of data, the non-JPY pairs were consistently unprofitable, losing money every single year due to the friction of spreads and commissions.
Conclusion
The fundamental issue is that re-crossing the H1 20-period EMA provides no predictive power for future price direction. The strategy relies on a symmetrical 1:1 risk-reward bracket that, once transaction costs are deducted, naturally gravitates toward a 50% win rate. The high win rates advertised elsewhere are likely the result of cherry-picking specific timeframes or currency pairs rather than a repeatable edge. Because there is no way to predict which market regimes will favor the JPY-specific “beta” without hindsight, this strategy cannot be recommended for systematic trading. It is essentially a directional gamble that is masked by high-volatility trends, which ultimately makes it too risky to sustain.
How this connects
This verification builds on earlier ones (what failed before and what I tried this time, comparisons between approaches).