Aligning three timeframes for pullbacks still loses
This multi-timeframe (MTF) pullback strategy, designed to enter trades on H1 dips during D1/H4 trends, fails to demonstrate a robust edge across…
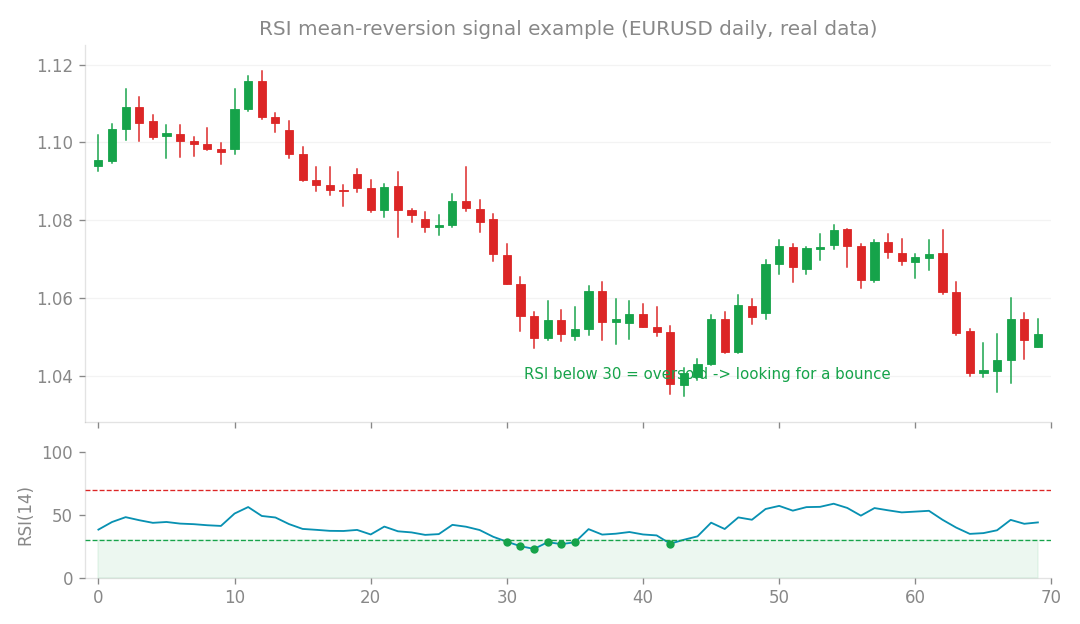
Mean-reversion (RSI) signal example (EURUSD daily, real data): look for a bounce when RSI is oversold.
This multi-timeframe (MTF) pullback strategy, designed to enter trades on H1 dips during D1/H4 trends, fails to demonstrate a robust edge across multiple assets. After testing 18 variations of the logic against historical data from 2015 to 2025, I found that the complexity added by multi-layer filters does not translate into consistent performance.
The Logic and Test Environment
The core concept is a classic trend-pullback model:
- Conditions: D1 20-period SMA deceleration, H4 20-period SMA deceleration against the D1 trend, and an H1 20-period SMA crossover in the direction of the D1 trend.
- Execution: Entry on H1 pullbacks, exit based on H4 trend exhaustion or deceleration.
- Scope: Tested on EURUSD, USDJPY, GBPUSD, AUDUSD, and XAUUSD. The system uses a precision event-driven engine, ensuring no look-ahead bias by referencing only the most recently confirmed bars for higher timeframes.
Performance Results
I evaluated 18 variants, including the user-provided “base” logic and various ablation versions (where specific filters were removed). To be considered a success, a variant needed a positive OOS (out-of-sample) net profit, a positive median Sharpe ratio, a profit factor (PF) above 1.1, and at least 60 trades.
| Metric | Base Logic Results |
|---|---|
| OOS Net Profit (Avg) | +10.4% |
| Median Sharpe Ratio | -0.32 |
| Median PF | 0.52 |
| Profitable Assets | 2 out of 6 |
| The “base” version, which includes all the elaborate filters, performed among the weakest. Adding these filters actually worsened or showed no improvement over simpler versions. | |
| The only variant that technically passed my criteria used an ATR-based exit (TP3/SL2), but this success was deceptive. The OOS net profit of +15.2% was driven almost entirely by a +92% return in USDJPY, while other assets remained flat or negative. Furthermore, 74.8% of the profits occurred during D1 uptrends between 2022 and 2024. In other words, this wasn’t a sophisticated MTF edge; it was simply capturing the market beta of the decade-long yen depreciation trend. |
Why the Strategy Struggles
The failure of this system highlights a recurring theme in my research:
- The Lag Wall: Filters like SMA deceleration are lagging indicators. They successfully narrow entry points but fail to add predictive power after accounting for trading costs.
- Beta vs. Edge: The strategy only functions as a trend-following vehicle on high-momentum assets like USDJPY. In average-reverting FX pairs and gold, this logic essentially evaporates.
- Exit-Driven Results: Switching the exit to ATR improved numbers simply because it allowed the system to stay in trends longer, not because the entry logic itself held predictive value. Ultimately, this MTF pullback approach does not provide a robust, generalizable edge. The positive results observed in USDJPY are a product of specific market regimes rather than a repeatable technical advantage. Future research could investigate whether this same framework shows promise in markets where momentum is more academically persistent, such as crypto or individual stocks. However, as it stands, this logic is not a viable tool for a multi-asset portfolio.
How this connects
This verification builds on earlier ones (what failed before and what I tried this time, comparisons between approaches).