
New EA Strategies: Why Weekly Average Regression Might Be a Trap, Not an Edge.
## My Latest Quest: Can Weekly Mean Reversion Boost My EA?
A beginner-friendly summary of the verification: “New EA Strategies: Why Weekly Average Regression Might Be a Trap, Not an Edge.”.
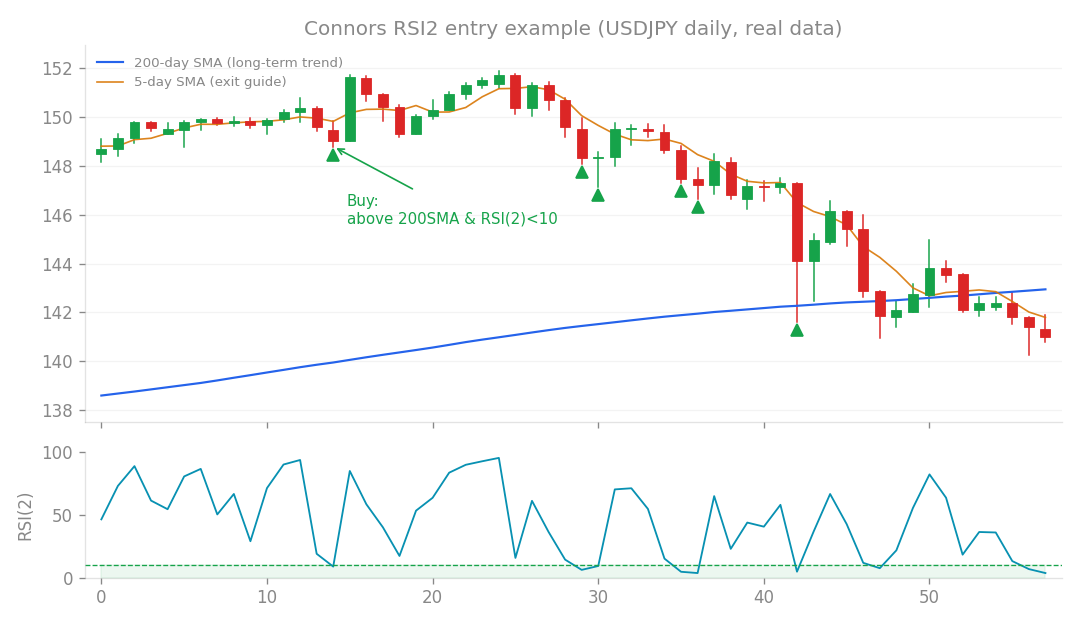
Connors RSI2 entry example (USDJPY daily, real data): buy the dip when price is above the 200-day SMA and RSI(2) falls below 10.
My Latest Quest: Can Weekly Mean Reversion Boost My EA?
I’m always on the hunt for new “edges” – those little statistical advantages that can give our Expert Advisors (EAs) a boost in the FX markets. My latest research, Study 133, focused on a specific idea: Weekly Mean Reversion (W1 RSI3). For those new to the terms:
- Mean Reversion (MR) is a trading strategy that assumes prices tend to revert to their average over time. Think of a stretched rubber band snapping back.
- RSI3 refers to the Relative Strength Index, using a short 3-period lookback. It’s a popular indicator for identifying potential short-term mean reversion points.
- W1 simply means we’re looking at the weekly timeframe. The core idea was to see if a mean reversion strategy applied to weekly charts could provide a unique, profitable edge, especially as an “additive sleeve” to our existing core strategies. An additive sleeve is like a complementary strategy that performs well when our main strategy might be struggling, smoothing out overall returns.
What Happened? (Spoiler: Not What I Hoped!)
My tests for Weekly Mean Reversion (W1 RSI3) yielded a stark result: zero positive edges across any currency pairs. In other words, I couldn’t find a single profitable setup. Why did it fail? It seems to be a combination of two factors:
- Low Trade Count: Weekly charts, by their nature, generate very few trading signals. With so few opportunities, it’s hard to build a robust statistical edge.
- MR’s Short-Term Nature: Mean reversion strategies typically thrive on short-term price fluctuations. Trying to apply this to a weekly timeframe, where price movements are much larger and slower, just didn’t work. This was similar to what I found in Research 129. So, Weekly Mean Reversion was a bust. But here’s where it gets really interesting… and a little sobering.
A Broader Pattern: The Search for Additive Strategies
This failure wasn’t an isolated incident. My recent research, spanning Studies 124 to 133, has systematically explored about a dozen different trading mechanisms since we optimized our core Connors strategy (v1.5.0). I’ve tested everything from:
- Shorting strategies
- Bollinger Bands
- “Breadth” indicators (looking at how many assets are moving in a certain direction)
- Regime Rotation (switching strategies based on market conditions)
- Mid-term Mean Reversion
- Overnight strategies
- Mean Reversion after consecutive down candles
- 52-week High Momentum
- Reversals after excessive down candles
- Weekly Donchian channels
- VWAP Mean Reversion
- Squeeze Breakouts
- Mean Reversion after a low close
- …and this latest Weekly Mean Reversion. The shocking conclusion? Every single one of these mechanisms was rejected. None of them provided a reliable, standalone edge, and more importantly, none proved to be a genuinely additive strategy to our existing core. It’s like trying to find a magical ingredient that makes your already-great cake even better, but everything you add either makes it taste the same or just plain bad!
Why It’s So Hard to Find New “Additive” Strategies
This consistent pattern of rejection led to a crucial insight, refined in Research 132: For a new strategy to be truly additive to our existing core (which excels at short-term mean reversion), it needs to exhibit inverse drawdown correlation. What does that mean? Imagine your core strategy’s performance over time. It will have periods where it’s making money and periods where it’s experiencing a drawdown (DD) – a decline from a previous peak. An ideal additive strategy would be making money (or at least not losing money) during those exact times when your core strategy is in a drawdown. It’s like having a backup generator that kicks in exactly when the power goes out. My research showed that to be truly additive to a short-term mean reversion strategy like Connors, a new mechanism would need to profit when the core is struggling, for example, during strong, sustained trends where mean reversion strategies often suffer. And here’s the kicker: The only type of strategy that naturally offers this kind of inverse correlation (by profiting from short-term reversals even within a larger trend) is… short-term mean reversion itself! And our core Connors strategy already captures this beautifully. So, any new mechanism we explore seems to fall into one of four traps:
- Rediscovering Trend: It ends up being a trend-following strategy. While trend-following is valid, its drawdowns often coincide with the drawdowns of short-term mean reversion strategies. This makes it non-additive; it doesn’t provide the desired diversification.
- Redundant with Connors: It’s essentially another form of short-term mean reversion, just less efficient, and thus redundant with what we already have.
- No Edge: It simply doesn’t have a statistically significant advantage, meaning its Profit Factor (PF) – gross profit divided by gross loss – is not consistently above 1.0 (the breakeven point).
- Killed by Costs: Any potential edge it might have is completely eaten up by trading costs like spreads and commissions. It appears the two major sources of return in price action – trend following and short-term reversal (mean reversion) – have already been thoroughly “tapped” by existing strategies.
What I Learned (And Where We Go From Here)
This extensive exploration has been an eye-opener. While I wouldn’t definitively declare it a “ceiling,” continuing to brute-force enumerate new mechanisms within the current framework risks falling into the trap of data dredging. This is where you test so many ideas on the same data that you eventually find spurious patterns that look good in a backtest but have no real predictive power in live trading. It’s like finding a constellation in random stars. The structural conclusion for now is clear: Connors (our short-term mean reversion core) seems to be a rare and unique additive strategy within our current universe of FX data and constraints. For truly new, uncorrelated, and additive sources of profit, we likely need to look beyond the current data and asset classes, perhaps exploring new datasets or entirely different markets outside our current prop trading constraints. It’s a tough realization, but an honest one. Finding truly new, robust, and uncorrelated edges in the FX market is an incredibly challenging endeavor. But that doesn’t mean the search stops here – it just means we need to think bigger and perhaps look in entirely new places!
How this connects
This verification builds on earlier ones (what failed before and what I tried this time, comparisons between approaches).