
3 Mean Reversion EAs Failed! But We Uncovered Crucial Insights
Finding new algorithmic trading strategies, or "sleeves," to add to your existing Expert Advisor (EA) is always an exciting prospect. The goal isn't j
A beginner-friendly summary of the verification: “3 Mean Reversion EAs Failed! But We Uncovered Crucial Insights”.
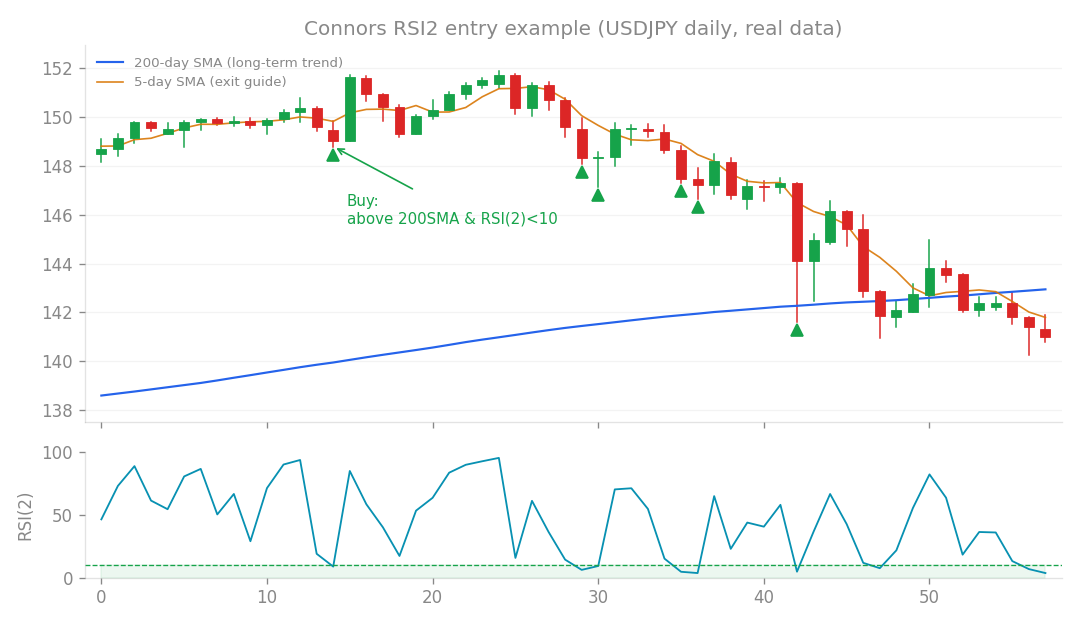
Connors RSI2 entry example (USDJPY daily, real data): buy the dip when price is above the 200-day SMA and RSI(2) falls below 10.
Finding new algorithmic trading strategies, or “sleeves,” to add to your existing Expert Advisor (EA) is always an exciting prospect. The goal isn’t just to find profitable strategies, but ones that can genuinely diversify your portfolio, meaning they perform well when your main EA might be struggling. This helps smooth out equity curves and reduce overall risk. In this batch of research, I explored three new ideas, and while some initially looked promising, they led to a crucial insight about diversification.
What’s the idea?
I tested three distinct strategies, hoping to find some gems:
- VWAP Deviation Mean Reversion (MR): This strategy looks for instances where the price of an asset deviates significantly from its VWAP (Volume-Weighted Average Price). The idea behind Mean Reversion (MR) is that prices tend to return to their average over time. So, if the price gets too far from VWAP, this strategy bets it will snap back.
- Low Close Mean Reversion (MR): Another Mean Reversion strategy, this one focuses on price action at the end of a trading period. If a candle closes near its low, it might suggest an oversold condition, prompting a bet on a bounce back up.
- Bollinger Band Squeeze Breakout (BO): This is a classic volatility-based strategy. Bollinger Bands (BB) are lines plotted around a price’s moving average. When these bands “squeeze” together, it indicates low volatility. The strategy then waits for a breakout (BO) – a strong move in price that pushes outside the squeezed bands – signaling the start of a new trend.
How I tested it
To evaluate these strategies, I used a few key metrics:
- Profit Factor (PF): This is a simple but powerful ratio of your gross profit divided by your gross loss. A PF greater than 1 means you’re making more money than you’re losing, which is a good start!
- Sharpe Ratio: This metric measures the return of an investment in relation to its risk. A higher Sharpe Ratio generally means a better risk-adjusted return.
- Connors Correlation: This is a special correlation metric that helps us understand how similar two strategies trade, particularly in their sequence of wins and losses. A high Connors correlation (closer to 1) means they’re very similar, while a low correlation (closer to 0) suggests they trade differently.
- Core Correlation: Similar to Connors, this is another correlation metric, often focusing on the daily P&L movements between strategies.
- Out-of-Sample (OOS) Testing: Also known as “forward testing,” this is crucial. It means testing the strategy on data it has never seen before. If a strategy performs well OOS, it gives us more confidence that it might work in live trading.
- Drawdown (DD): This is the maximum percentage drop from a peak in your trading account’s equity. It’s a critical measure of risk – nobody wants huge drawdowns!
What happened?
Let’s dive into the results for each strategy:
The Mean Reversion Duo
Both the VWAP Deviation MR and Low Close MR strategies showed decent individual performance:
- VWAP Deviation MR: It had a respectable Profit Factor (PF) of 1.63 and a Sharpe Ratio of 0.96.
- Low Close MR: This one was even stronger, with a PF of 1.35 and a high Sharpe Ratio of 1.39. On paper, these look pretty good! However, the crucial factor for diversification came into play:
- The Connors Correlation for VWAP Deviation MR was 0.52.
- The Connors Correlation for Low Close MR was 0.55. In other words, these numbers are quite high for strategies meant to be “different.” A Connors correlation above 0.5 suggests that these strategies are trading too similarly to existing Mean Reversion strategies we already have. They would essentially be redundant, not adding true diversification. It’s like having two flavors of vanilla ice cream when you’re looking for something entirely new. The verdict for both Mean Reversion strategies: Rejected. They simply didn’t offer the unique diversification we were looking for.
The Bollinger Band Squeeze Breakout
This one was a real rollercoaster! Initially, it looked incredibly promising:
- It boasted an excellent Profit Factor (PF) of 1.81.
- Even better, its Core Correlation was a tiny 0.07, and its Connors Correlation was an equally minuscule 0.13. Both were practically zero, indicating a genuinely uncorrelated strategy! This was exciting because low correlation usually points to great diversification potential.
- It even passed Out-of-Sample (OOS) testing with a PF of 1.36 over 71 trades, which is a solid result for forward performance. This strategy seemed like a winner, a perfect “sleeve” to add to our core EA. But here’s where things took a turn. When I ran it alongside our existing core strategy (v1.5.0), its performance actually worsened the overall system:
- The monthly P/L ratio dropped from 0.99 to 0.74.
- The total Drawdown (DD) significantly deteriorated, increasing from -9.4% to -13.3%. In other words, instead of reducing risk and improving overall performance, it made things worse when combined. Despite its low correlation and good individual performance, it failed to provide the desired diversification in a real-world combined scenario. The verdict for the Bollinger Band Squeeze Breakout: Rejected. This one was a particularly tough pill to swallow given its initial promise.
What I learned: The Big Aha!
This research, especially the failure of the Bollinger Band Squeeze Breakout, led to a critical realization that changed how I approach diversification. The key insight is this: “Low daily correlation does NOT automatically mean Drawdown diversification.” Think of it this way: Imagine you have two friends (representing two trading strategies). On any given day, they might be doing completely different things (low daily correlation in their activities). But what if both of them are generally “optimistic” and tend to invest in growth stocks? When the market for growth stocks suddenly crashes (a major “risk-off” event or trend reversal), both friends will suffer heavy losses at the same time, regardless of their daily differences. This is exactly what happened with the Squeeze Breakout strategy. Even though its daily movements were uncorrelated with our core EA, both were fundamentally “trend-following” and generally “long” market strategies. This means that when the market conditions turned unfavorable for trend-following or long positions (e.g., a sharp market reversal or a broad risk-off sentiment), both strategies took a hit simultaneously. Instead of diversifying risk, they concentrated it, making the overall drawdown worse. For a new strategy to truly be an additive sleeve – one that genuinely adds value and reduces overall risk – its drawdowns need to move inversely to the core strategy. Ideally, it should be making money when the core strategy is losing, especially during significant market downturns. And what kind of strategies consistently do this? Only Mean Reversion strategies tend to exhibit this inverse drawdown behavior, as they profit from prices returning to the average, often when trends are reversing or markets are choppy. And guess what? This is exactly what the Connors Correlation was already hinting at! Strategies with high Connors correlation are too similar, and those with low correlation but similar directional bias will still suffer simultaneously during major market shifts. The big takeaway: Don’t be fooled by low daily correlation alone. True diversification comes from strategies that genuinely profit from different market conditions than your core, ideally those that make money when your core is struggling. Trend-like strategies, even with low daily correlation, often fail to provide this critical drawdown diversification. This consistent pattern has now been observed across all eight strategies tested in these recent batches, giving us a powerful guiding principle for future research!