
4 New FX EA Strategies Crumbled! What Failure Taught Us About Winning
## What was the big idea?
A beginner-friendly summary of the verification: “4 New FX EA Strategies Crumbled! What Failure Taught Us About Winning”.
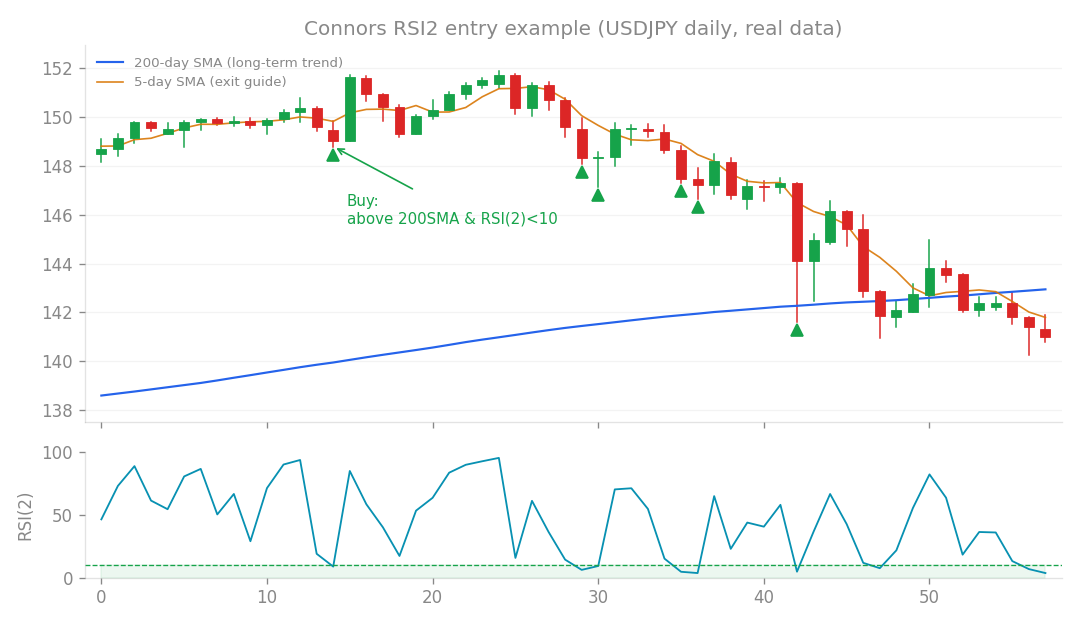
Connors RSI2 entry example (USDJPY daily, real data): buy the dip when price is above the 200-day SMA and RSI(2) falls below 10.
What was the big idea?
As an EA developer, I’m always on the hunt for new trading “mechanisms” – those unique patterns or behaviors in the market that an algorithm can exploit for profit. But it’s not enough for a strategy to just make money on its own. It also needs to play nice with our existing portfolio, ideally adding diversification without piling on more risk. Think of it like building a diverse team: you don’t want everyone to have the exact same skill set, right? For this particular research batch (Research 131), I tested four new trading ideas, all focused on long positions in uptrending markets. To evaluate them, I used three key criteria:
- Edge: Does the strategy have a statistical advantage? My go-to metric here is Profit Factor (PF). Simply put, it’s your gross profit divided by your gross loss. A PF greater than 1 means the strategy is profitable. The higher, the better!
- Core Correlation: How much does this new strategy overlap with our existing “core” strategies, which are generally trend-following? A high correlation here means it’s likely just “rediscovering” trends we already capture, adding redundancy rather than diversification.
- Connors Correlation: How much does it overlap with our existing “Connors-style” strategies, which are typically mean-reversion (buying dips)? Again, a high correlation suggests redundancy. My goal was to find strategies with good edge, but low correlation to both our core and Connors-style EAs. That’s the sweet spot for true portfolio diversification!
The Candidates: Four New Ideas
Here’s a look at the four mechanisms I put to the test:
1. The “Consecutive Bearish Candlestick Mean Reversion”
The Idea: This strategy looked to buy after a certain number of consecutive bearish (down) candlesticks. The logic is simple: after several days of decline, an asset might be “oversold” and due for a bounce back – a classic mean-reversion play. What Happened: Initially, this one looked promising with a PF of 1.28. That’s a decent profit factor, suggesting it could make money. However, when I checked its Connors Correlation, it was a high 0.73. In other words: While it was profitable, it was essentially doing the exact same thing as our existing short-term mean-reversion strategies. It was just finding the “same dips” using a slightly different trigger. It’s like having two different alarm clocks that both go off at 7 AM; they both work, but you don’t really need both! This redundancy means it wouldn’t add any meaningful diversification to our portfolio. My Conclusion: Rejected. It offered no unique value.
2. The “52-Week High Momentum”
The Idea: This strategy aimed to identify and buy instruments that were hitting new 52-week highs, riding the momentum upwards. It’s a classic “buy high, sell higher” approach, looking to capitalize on strong trends. What Happened: This strategy started with a bang! It boasted an impressive PF of 1.58 in initial tests. Its Core Correlation was 0.43 (moderate) and Connors Correlation was 0.32 (low). This looked like a potential winner, showing some independence from our existing strategies. Even better, it passed a forward test (Out-of-Sample or OOS) with flying colors, showing a PF of 1.33 and a Sharpe Ratio of 0.38. The Sharpe Ratio measures risk-adjusted return, and a positive number here after an OOS test truly suggests a “real” momentum edge, not just a curve-fitted fluke. We were excited! But then came the crucial test: running it alongside our existing core portfolio (specifically, our v1.5.0 system). This is where the rubber meets the road, as strategies sometimes behave differently in isolation versus in a combined portfolio. The Disaster: When combined, the “52-Week High Momentum” strategy actually worsened our overall portfolio performance significantly:
- Monthly Compounding (MC), which measures how much our capital grew each month when profits were reinvested, dropped from 96% to 85%. Ouch!
- Our Maximum Drawdown (DD), the largest peak-to-trough decline in our account, worsened from -9.4% to a painful -16.7%. Double ouch! In other words: Even though it looked great on its own, when added to the mix, it made our entire portfolio more volatile and less profitable. Why it failed: The moderate Core Correlation of 0.43 was the culprit. It meant this strategy was essentially “rediscovering a trend” that our existing core EAs were already trading. Instead of diversifying, it just concentrated our exposure to the same trends. When those trends inevitably pulled back, we got hit harder because more of our strategies were betting on the same thing. It’s like building a football team where everyone is a fantastic quarterback – great talent, but you’re going to have a bad time when you need a defensive lineman! This is a common pitfall, similar to issues we’ve seen in past research with Ichimoku or Supertrend-based strategies. My Conclusion: Rejected, despite its initial promise.
3. The “Excessive Bearish Candlestick Reversal”
The Idea: This was another mean-reversion concept, looking for extremely large bearish candlesticks as a signal for an imminent reversal. What Happened: This one was quick and easy to evaluate. It showed zero edge in any of the instruments tested. In other words: It just didn’t work. At all. My Conclusion: Rejected. A complete dud.
4. The “Weekly Donchian Channel Breakout”
The Idea: This is a classic trend-following strategy that looks to enter a trade when the price breaks out of a defined channel (the Donchian Channel) on a weekly timeframe, signaling a new trend. What Happened: This strategy only showed minimal, extremely small potential in just two instruments. In other words: The edge was tiny, almost negligible, and only appeared in a couple of obscure corners of the market. Even if it did work, transaction costs would likely eat up any potential profit. It’s like finding a few pennies on the street – not worth the effort to pick them up for a professional treasure hunter! My Conclusion: Rejected. Too insignificant to pursue.
What I Learned: The Recurring Patterns of Failure
So, after all that testing, the big conclusion for Research 131 is clear: all four new mechanisms were rejected. This batch of research really hammered home some recurring patterns I’ve noticed in my quest for new, truly diversified trading strategies. New ideas often fall into one of these traps:
- “Rediscovering a Trend”: Many seemingly new strategies just find existing trend patterns, leading to high Core Correlation. They don’t diversify; they concentrate risk.
- “Redundant Mean Reversion”: Similarly, many mean-reversion ideas end up having high Connors Correlation, meaning they just replicate what our existing dip-buying strategies already do.
- “No Edge”: Some ideas simply don’t have any statistical advantage over random chance.
- “Eaten by Costs”: Even if a strategy shows a tiny edge, transaction costs (commissions, spread) quickly gobble up any potential profit, making it unviable in the real world. Finding genuinely uncorrelated strategies – those rare gems that truly add diversification and improve a portfolio’s overall risk-adjusted returns – is incredibly difficult. It seems the market’s inefficiencies often fall into predictable categories, and it takes a lot of digging to find something truly novel. The search continues!
How this connects
This verification builds on earlier ones (what failed before and what I tried this time, comparisons between approaches).