
The Overnight Drift: A Real Anomaly Our EA Couldn't Profit From!
## What's the idea?
A beginner-friendly summary of the verification: “The Overnight Drift: A Real Anomaly Our EA Couldn’t Profit From!”.
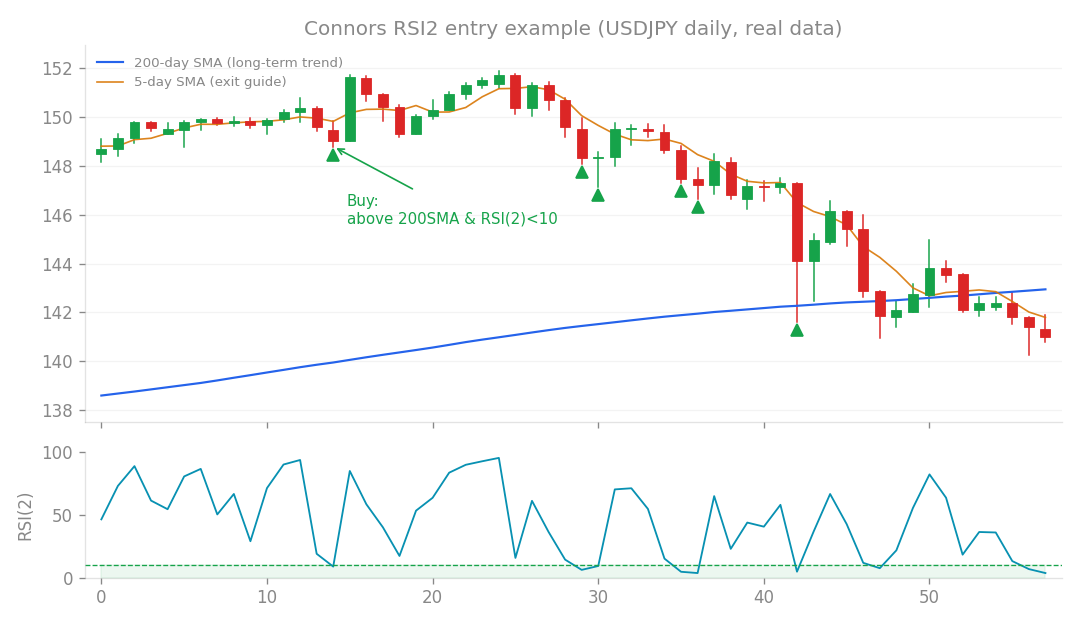
Connors RSI2 entry example (USDJPY daily, real data): buy the dip when price is above the 200-day SMA and RSI(2) falls below 10.
What’s the idea?
Imagine a trading strategy that mostly makes money while you’re asleep. That’s the core concept behind “overnight drift,” an intriguing market anomaly. Academics have found that a significant portion of stock market returns, especially in major indices, often happens during the “overnight” period – that’s from yesterday’s closing bell to today’s opening bell. In other words, the market tends to gap up more often than down, and these gaps contribute heavily to overall gains. This isn’t about traditional trend following or mean reversion; it’s a structural phenomenon tied to specific times of the day. My goal was to investigate if we could harness this “night shift” effect for our algorithmic trading (EA) strategies, specifically by going long (buying) during the overnight period when the market showed an upward bias.
How I tested it
To dig into this, I looked at historical data for major US index CFDs: the US500 (S&P 500), US100 (Nasdaq 100), and US30 (Dow Jones Industrial Average). I specifically broke down their daily movements using their Open, High, Low, and Close (OHLC) prices. The strategy was simple in concept: identify periods of an upward trend and then try to capture the overnight gains by buying at yesterday’s close and selling at today’s open. This effectively means holding a long position only during the hours when the main market is closed.
What happened?
The Anomaly is Real!
First, the good news: the “overnight drift” anomaly is absolutely real and surprisingly robust.
- US500: Over the long term, the overnight period generated a staggering +6.8% annual return, while the daytime trading (open to close) only managed a paltry +0.4%. In other words, almost all the gains happened while the market was technically “closed”! This overnight performance also came with an impressive Sharpe Ratio of 1.35. (A Sharpe Ratio measures risk-adjusted return; generally, anything above 1.0 is considered good, and 1.35 is excellent!)
- US100: This tech-heavy index saw even better overnight performance, clocking in at +10.1% annually.
- US30: The Dow also showed positive overnight drift, with +4.7% annually. What’s even more exciting is that this anomaly proved to be largely uncorrelated with our existing strategies. The “Core correlation” was a tiny +0.02, and the “Connors correlation” was +0.20. This is fantastic news because it means this strategy wasn’t just doing what our existing EAs already do – it offered true diversification potential, which is gold in portfolio management!
But Then, Costs Killed It
Now for the bad news, and it’s a big one. While the anomaly itself is powerful, the practicalities of trading it are brutal. Capturing these overnight gains means making a round-trip trade every single day – buying at the previous close and selling at the next open. That’s roughly 250 trades a year. Let’s talk about trading costs, often measured in “basis points” (bp), where 1bp is 0.01%.
- At 0bp cost: The strategy would have yielded a fantastic +7.2% annually with a Sharpe Ratio of 1.25. (Pure theoretical profit!)
- At 1bp cost: Profits dropped to +4.7% annually.
- At 2bp cost: Profits dwindled to +2.2% annually, and the Sharpe Ratio fell to a weak 0.37.
- At 3bp cost: The strategy turned negative, losing -0.4% annually! In other words, just a tiny 3 basis point round-trip cost completely wiped out all potential profits and then some! The reality is, trading index CFDs at market open and close often involves wider spreads and higher transaction costs than during regular trading hours. A realistic round-trip cost for such daily trades could easily be 2-4 basis points. This means that in a real-world scenario, this strategy would likely generate less than 2% annually, or even consistently lose money. It’s like finding a treasure map, but the cost of the expedition (the trading fees) ends up being more than the treasure itself!
What I learned
This research was a fascinating journey into a genuine market anomaly, but it delivered a sobering lesson:
- The Overnight Drift is Real and Uncorrelated: This anomaly is academically robust and offers excellent diversification potential. That’s a huge positive for understanding market dynamics.
- High-Frequency Trading + Costs = Death: This strategy is a classic example of how transaction costs can completely decimate even a statistically strong edge. Daily round-trip trading, especially in periods with potentially wider spreads (like market open/close), makes it incredibly difficult to be profitable. This echoes findings from other high-frequency strategies we’ve explored that also fell victim to costs.
- Execution Complexity: Beyond just the spread, executing trades precisely at the open and close can be challenging due to potential slippage, further eroding any theoretical edge. This complexity makes it unsuitable for stable, automated proprietary trading. Ultimately, while the “overnight premium” is a real phenomenon, our findings confirm the academic consensus: it’s extremely difficult to capture this premium profitably after accounting for real-world trading costs. This stands in stark contrast to lower-frequency strategies, like those inspired by Connors, which involve holding positions for several days and are therefore much more robust to transaction costs. For now, despite its intrigue, this “night shift” strategy won’t be joining our arsenal. We’re sticking with our currently proven and cost-effective strategies (like our v1.5.0 suite). It’s a great example of how a compelling theoretical edge can be undone by the practicalities of the market.
How this connects
This verification builds on earlier ones (what failed before and what I tried this time, comparisons between approaches).