
The Limits of Mean Reversion: Why Our EA Found No Edge With RSI14!
We're always on the hunt for new ways to make our algorithmic trading strategies (EAs) more robust and profitable. Sometimes that means exploring comp
A beginner-friendly summary of the verification: “The Limits of Mean Reversion: Why Our EA Found No Edge With RSI14!”.
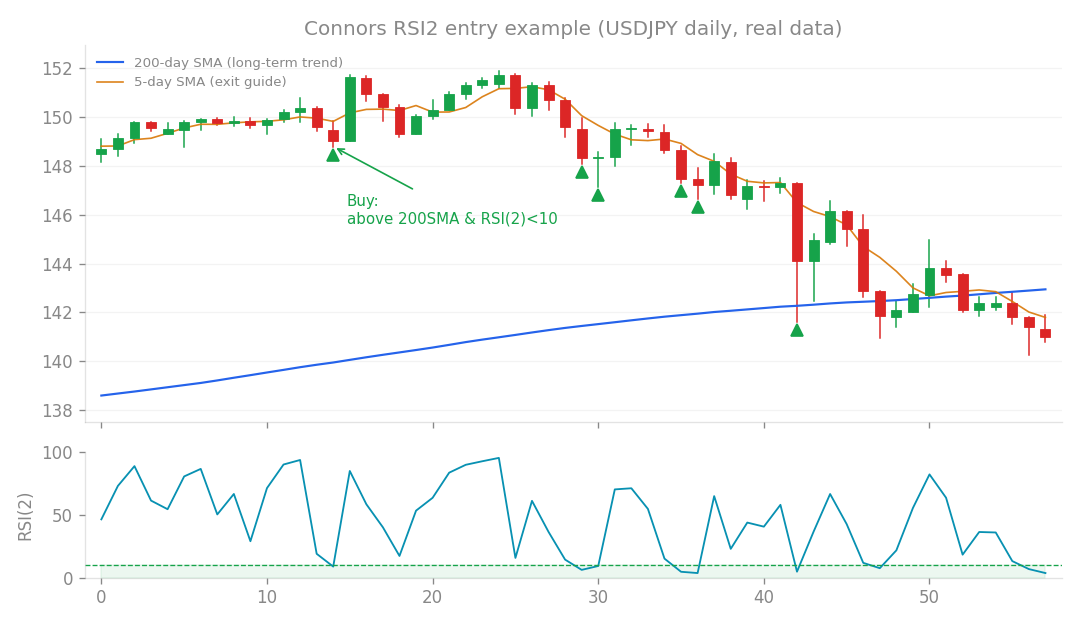
Connors RSI2 entry example (USDJPY daily, real data): buy the dip when price is above the 200-day SMA and RSI(2) falls below 10.
We’re always on the hunt for new ways to make our algorithmic trading strategies (EAs) more robust and profitable. Sometimes that means exploring completely new ideas, and sometimes it means trying to find variations on strategies that already work. This time, we explored a variation on a well-known mean reversion approach.
What’s the idea?
Mean reversion is a core concept in trading. It’s the idea that if an asset’s price moves significantly away from its average, it’s likely to snap back towards that average. Think of it like a stretched rubber band – eventually, it’s going to recoil. One of the most effective mean reversion strategies, often associated with Connors, focuses on ultra-short-term price movements. This usually involves a very short Relative Strength Index (RSI), like an RSI 2, looking for extreme oversold conditions over just a couple of days. If the market sells off too quickly in a short period, it’s often an overreaction, and prices tend to bounce back. My question for this research was: Could we find a new mean reversion “sleeve” – essentially, an independent, profitable strategy – by looking at a medium-term timeframe? Instead of RSI 2, I wanted to test RSI 14. Specifically, I was looking for situations where the RSI 14 dropped below 30, indicating a more sustained, but still potentially oversold, condition. The hope was that this medium-term approach might capture different market dynamics, uncorrelated with the ultra-short-term Connors strategy. (Quick jargon check: RSI or Relative Strength Index is a momentum indicator that tells you if an asset is overbought or oversold. A reading below 30 typically suggests it’s oversold. A sleeve here just means a distinct, independent trading strategy that can run alongside others.)
How I tested it
To test this idea, I set up an experiment:
- I focused on the RSI 14 indicator.
- The entry signal was when RSI 14 dropped below 30, suggesting the asset was becoming oversold over a medium timeframe.
- I then backtested this strategy across a wide range of currency pairs (that’s what “all currency pairs” in the notes refers to).
- The goal was to find strategies that achieved a Profit Factor (PF) greater than 1.05. (Another quick jargon check: Profit Factor (PF) is a simple but powerful metric. It’s calculated as Gross Profit / Gross Loss. A PF of 1 means you broke even. A PF greater than 1 means you made a profit. We usually aim for at least 1.05 or higher to consider a strategy viable, as it indicates a healthy margin of profit over losses.)
What happened?
Here’s the blunt truth: The results were stark. Across all the currency pairs I tested, zero strategies achieved a Profit Factor greater than 1.05. In other words, the medium-term mean reversion strategy using RSI 14 showed no edge whatsoever. It simply didn’t work.
What I learned
This “failure” actually taught us a crucial lesson about mean reversion and market dynamics. The core insight is that the “edge” in mean reversion strategies seems to be highly specific to ultra-short-term, extreme overreactions. Think of it this way:
- Ultra-short-term mean reversion (like RSI 2): This works when the market experiences a sudden, violent sell-off – a “snapback” from a “violent throwaway” over just a couple of days. This is often a genuine market overreaction, where prices are pushed down too far, too fast, and then quickly correct themselves. It’s like stretching that rubber band too far, too quickly – it has no choice but to recoil hard.
- Medium-term declines (like RSI 14): When an asset experiences a more gradual, medium-term decline, it’s often not an overreaction. Instead, it’s more likely a sign of underlying weakness, a shift in sentiment, or the beginning of a sustained trend. In these cases, the price tends to continue its decline rather than bouncing back. It’s like a slowly deflating balloon – it just keeps going down. There’s no “snap” waiting to happen. This means that the existing Connors (RSI 2) strategy, which focuses on those extreme, ultra-short-term oversold conditions, already captures the only mean reversion edge that truly exists in these markets. Trying to find that same mean reversion effect on a different, longer timeframe simply doesn’t yield new opportunities because the market dynamics are fundamentally different. So, while it was a great idea to explore, this research confirms that looking for mean reversion on a different timeframe doesn’t create a new, independent trading “sleeve.” Our current EA, v1.5.0, remains unchanged, as it’s already optimized for the real mean reversion opportunities out there. Sometimes, knowing what doesn’t work is just as valuable as knowing what does!