
EA v1.5.0: The Ultimate Balance of Monthly Profit and Risk Revealed!
## What's the Idea? Pushing the Monthly Return Frontier!
A beginner-friendly summary of the verification: “EA v1.5.0: The Ultimate Balance of Monthly Profit and Risk Revealed!”.
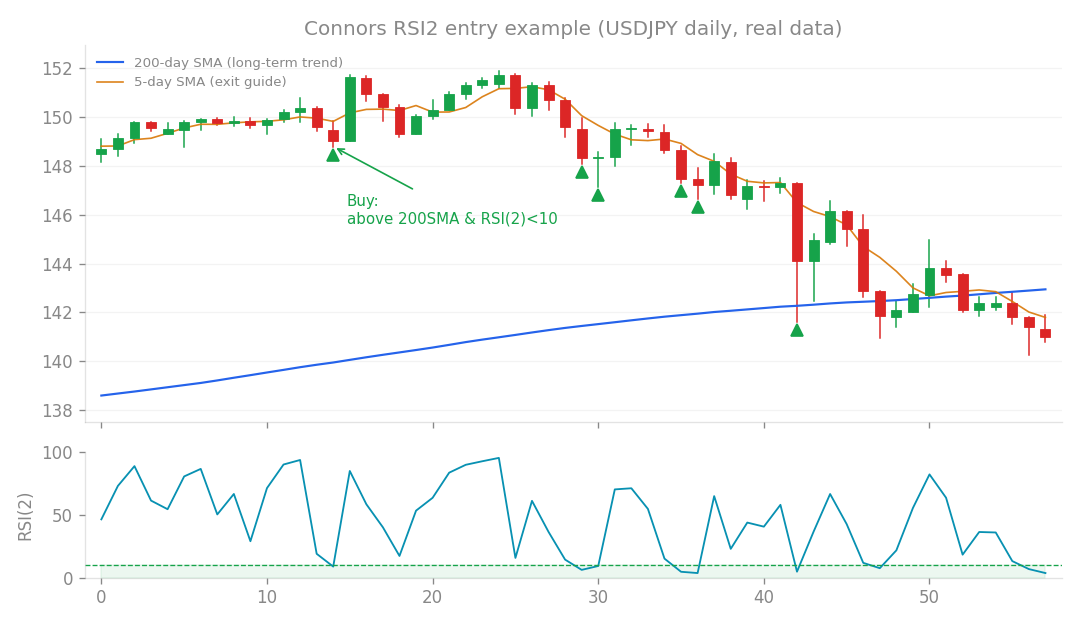
Connors RSI2 entry example (USDJPY daily, real data): buy the dip when price is above the 200-day SMA and RSI(2) falls below 10.
What’s the Idea? Pushing the Monthly Return Frontier!
In the world of algorithmic FX trading (EAs), we’re constantly trying to find that sweet spot: the highest possible monthly return for a given level of risk. We call this the “monthly return frontier.” It’s like finding the edge of what’s possible with our current strategies. Today, we’re diving into a re-evaluation of our v1.5.0 strategy, specifically looking at how much monthly profit we can squeeze out while keeping a lid on drawdowns. For this research, we took our existing strategy and systematically “re-leveraged” it. This means we adjusted the overall risk level using different multipliers. Think of it like turning up the volume dial on your amplifier – you get more sound, but also more potential for distortion. Our goal was to measure the direct relationship between the potential “monthly return” and the “maximum drawdown” (DD). Quick Jargon Explainer:
- Maximum Drawdown (DD): This is the largest peak-to-trough decline in your account balance during a specific period. If your $10,000 account drops to $9,000 before recovering, your DD is $1,000 or 10%. It’s a key measure of risk!
- Calmar Ratio: A performance metric that compares a strategy’s average annual return to its maximum drawdown. A higher Calmar Ratio is generally better, indicating more return for less risk. A Calmar ratio around 1.0 means your annual return is roughly equal to your max drawdown. In our tests, the Calmar ratio consistently hovered around 1.0 to 1.1, suggesting a pretty balanced relationship between return and risk.
How I Tested It: Climbing the Leverage Ladder
To map out this frontier, I ran the v1.5.0 strategy with various leverage multipliers. This allowed us to see how performance metrics shifted as we ratcheted up the risk. Here’s what we found in our raw backtest results:
- x1.0 Multiplier (Our Baseline):
- Monthly Return: +0.93%
- Max Drawdown: -9.4%
- Robustness (MC): 96%
- In other words: With relatively conservative settings, we’re looking at just under 1% monthly return with less than 10% potential drawdown. The “Robustness (MC)” here indicates a high degree of confidence in these results, perhaps from Monte Carlo simulations or a similar stability measure.
- x1.6 Multiplier:
- Monthly Return: +1.27%
- Max Drawdown: -13.3%
- Robustness (MC): 91%
- In other words: A noticeable jump in monthly return, but our drawdown also increased, and the robustness dipped slightly.
- x2.0 Multiplier:
- Monthly Return: +1.46%
- Max Drawdown: -15.4%
- Robustness (MC): 84%
- In other words: Approaching 1.5% monthly, but the drawdown continues to climb, and our robustness measure shows a further decrease in confidence.
- x2.4 Multiplier:
- Monthly Return: +1.64%
- Max Drawdown: -17.6%
- In other words: The highest return in this test, but with a significantly larger potential drawdown. (Robustness data was not explicitly noted for this level, but we can assume the trend continues). The relationship between monthly return and max drawdown appeared quite linear – as we increased the risk, the potential reward generally increased proportionally. For a 10% drawdown, the monthly return consistently stayed in the 0.93-0.99% range.
The Big Improvement: v1.5.0 Shines!
Now for the exciting part! Comparing these results to our “old frontier” (from Research 70), where we saw around 0.6% monthly return for a drawdown of 10% or less, v1.5.0 represents a huge leap forward. For a maximum drawdown of 10% or less, our monthly return has improved by approximately 50-65% – from ~0.6% to ~0.93% (or even ~0.99% if we push DD right to 10%)! This substantial improvement isn’t magic; it’s the result of several strategic enhancements we’ve made to the EA, including:
- Vol-Targeting: Adjusting trade size based on market volatility, helping to manage risk dynamically.
- Equity Logic: Incorporating more sophisticated rules related to overall account equity.
- HTF (Higher Time Frame) analysis: Using data from longer timeframes to get a broader market perspective.
- Connors-inspired concepts: Likely integrating elements from well-known trading strategies to improve entry and exit signals. These cumulative improvements have significantly “bottomed out” our safe monthly return potential.
The Reality Check: Accounting for Real-World Costs
Of course, backtest results are one thing, but real-world trading comes with real costs. Things like slippage (when your order fills at a different price than expected) and commissions can eat into your profits and even increase your effective drawdown. We factored in a “real cost adjustment” (based on insights from Research 106), which suggests that these real-world frictions can lead to a “transfer rate” of 88-95% (meaning only 88-95% of theoretical profits actually materialize) and can increase your observed drawdown by an additional 1.5-2%. After adjusting for these practical considerations, here’s what our conservative and aggressive scenarios look like:
- Conservative Scenario:
- Monthly Return: ~0.8%
- Max Drawdown: ~10%
- Robustness (MC): 96%
- In other words: A slightly lower but still very solid monthly return, maintaining excellent robustness at a manageable drawdown. This is a realistic target for those prioritizing capital preservation.
- Aggressive Scenario:
- Monthly Return: ~1.3%
- Max Drawdown: ~15%
- Robustness (MC): 84%
- In other words: Pushing for higher returns means accepting a larger drawdown and a slightly lower robustness, but still delivering a respectable monthly profit.
What I Learned: The “2% Dream” and New Baselines
Despite these fantastic improvements, one key takeaway remains: a consistent 2% monthly return with a truly “safe” drawdown is still out of reach. Our Calmar ratio ceiling of 1.0-1.1 still holds true. To hit 2% monthly, you’d realistically need to accept a much higher drawdown, likely in the 22-24% range. That’s a level of risk many might find uncomfortable for a consistent target. However, the good news is that v1.5.0 has significantly raised our baseline! We’ve effectively increased the monthly return achievable with a “safe” drawdown (around 10%) from a previous ~0.6% to a much more attractive ~0.9%. And for those willing to take on a bit more risk, an aggressive approach can now realistically aim for around 1.3% to 1.45% monthly, even after accounting for real-world costs. This isn’t about promising sky-high, unrealistic profits. It’s about continuously refining our strategies to push the boundaries of what’s possible, while always staying grounded in realistic expectations and robust risk management. We’ve made fantastic progress with v1.5.0, offering a stronger foundation for consistent, if not extravagant, monthly returns.
How this connects
This verification builds on earlier ones (what failed before and what I tried this time, comparisons between approaches).