
Market-Wide Oversold: Our EA Found a Real Mean Reversion Insight!
## What's the Big Idea?
A beginner-friendly summary of the verification: “Market-Wide Oversold: Our EA Found a Real Mean Reversion Insight!”.
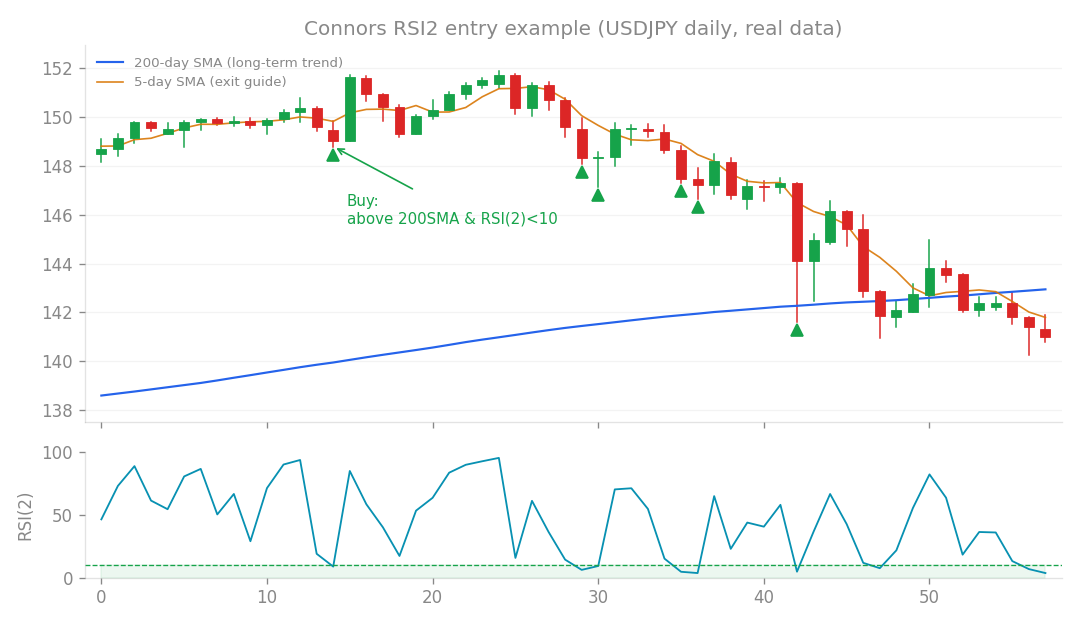
Connors RSI2 entry example (USDJPY daily, real data): buy the dip when price is above the 200-day SMA and RSI(2) falls below 10.
What’s the Big Idea?
When you trade with Expert Advisors (EAs), you’re often looking for an edge. One classic strategy is mean reversion, which basically means buying something when it’s “oversold” – betting that its price has dropped too far, too fast, and is due for a bounce back to its average. Think of it like a stretched rubber band snapping back. A common Connors-style mean reversion EA usually looks at individual currency pairs or stocks to find these oversold conditions. But we had a thought: what if we could get an even sharper rebound? Our hypothesis was that if not just one, but many currency pairs or assets were simultaneously oversold – what we call “market breadth” or “capitulation” – then the rebound would be much stronger. Imagine everyone in the market panicking and selling at once; surely that’s the ultimate “buy the dip” signal, right? We were hoping this “breadth-linked” approach would supercharge our mean reversion EA.
How We Put It to the Test
To test this idea, we used a mean reversion EA as our base. Then, we introduced a new variable: market breadth. We measured this by calculating the percentage of instruments (currency pairs, in this case) that were simultaneously showing oversold conditions at the point of an entry signal. We then took all the trades our EA generated and sorted them into five groups, or “quintiles,” based on this market breadth percentage:
- Q1: Trades where market breadth was very low (meaning only a few instruments were oversold – close to zero). We called this “isolated oversold conditions.”
- Q5: Trades where market breadth was very high (meaning 18% or more of instruments were simultaneously oversold). This represents a market-wide sell-off or “capitulation.” For each group, we analyzed key performance metrics:
- Win Rate: The percentage of trades that made a profit.
- Profit Factor (PF): This is calculated as your gross profit divided by your gross loss. A PF greater than 1 means the strategy is profitable overall. For example, a PF of 2.0 means you make twice as much in winning trades as you lose in losing trades.
- We also looked at correlations and other metrics to see how market breadth influenced trade outcomes.
The Surprising Results
Here’s where things got really interesting, and frankly, quite counter-intuitive! Our initial hypothesis was completely turned on its head. We found that the higher the market breadth (meaning more instruments were simultaneously oversold), the worse the trade performance was. Let’s look at the numbers:
- Q1 (Isolated Oversold Conditions): These trades, where only a few instruments were oversold, performed exceptionally well. They had a win rate of 79.9% and a fantastic Profit Factor (PF) of 2.25. In other words, when only a few assets were dipping, the rebound was strong and reliable.
- Q5 (High Market Breadth / Capitulation): On the other hand, trades initiated during market-wide sell-offs showed significantly worse results. The win rate dropped to 59.7%, and critically, the PF was only 0.97. A PF below 1.0 means that, on average, the strategy was losing money on these types of trades. We also saw a clear negative correlation: as market breadth increased, both the expected value per trade and the likelihood of a winning trade decreased. Specifically, when market breadth hit 0.3 (meaning 30% or more instruments were simultaneously oversold), the PF plummeted to 0.78, indicating consistent losses. What does this mean? Our “buy the dip” idea seemed to fail spectacularly when everyone was selling. It appears that market-wide sell-offs aren’t healthy pullbacks but rather “falling knives” – true risk-off events where mean reversion often fails, at least in the short term. Isolated dips, however, still offer solid rebound opportunities.
The Plot Thickens: Filtering Didn’t Help!
Given these clear results, our next logical step was to try and improve our EA by avoiding trades during high market breadth. We implemented a filter to only take trades when market breadth was below 0.18 (i.e., less than 18% of instruments were oversold). Here’s what happened:
- Without the filter (plain system): Our baseline EA showed a respectable PF of 1.49, a Sharpe Ratio of 1.11 (which measures risk-adjusted return – higher is better), and a relative drawdown (r-DD) of 0.54.
- With the filter (breadth < 0.18): The PF dropped to 1.12, and the Sharpe Ratio fell significantly to 0.28. This was a clear degradation. But the real kicker came when we tested this filter on out-of-sample (OOS) data – data the system had never seen before. This is crucial for verifying if a strategy is truly robust.
- Plain system (OOS): Still showed a decent PF of 1.38.
- Filtered system (OOS): The performance worsened dramatically, with the PF dropping to a losing 0.86 and a negative Sharpe Ratio of -0.37. In other words, while the raw data within our test period suggested that high-breadth trades were bad, trying to filter them out actually made the overall system unprofitable when faced with new market conditions. It seems we were throwing out the baby with the bathwater!
What We Learned (The Real Takeaway)
This research, like some of our previous studies (Research 114 and 119), reinforces a powerful and recurring lesson: even if you identify characteristics that point to “low-quality” individual trades, simply removing them with a filter doesn’t always improve the overall system. Why? Because algorithmic trading systems often rely on a large number of trades and the power of diversification. By removing what we think are bad trades, we might also be:
- Removing some winning trades that occur within that “bad” category.
- Reducing the total number of trades, which can dilute the statistical edge the system relies on.
- Unintentionally breaking the delicate balance that makes the system profitable across various market conditions. The original Connors strategy, which takes all valid setups, appears to be optimal due to this diversification effect. However, this doesn’t mean our initial insight was worthless! The observation that “mean reversion during market-wide capitulation is low quality, while isolated dips are high quality” is a very real and valuable piece of market wisdom. This insight actually underpins the logic of our existing “Equity Risk-Off Filter (v1.4.0),” which is designed to avoid trading during severe stock market downturns. So, while we couldn’t use it as an explicit filter for this specific Connors-style EA, it confirmed a fundamental truth about market behavior that helps us refine other parts of our trading framework. Ultimately, our Connors EA (v1.5.0) remains unchanged. Sometimes, the simplest approach, trusting the diversification of many trades, is the most robust path to long-term profitability.
How this connects
This verification builds on earlier ones (what failed before and what I tried this time, comparisons between approaches).