
Conquering Weak Spots: Our Search for Uncorrelated EA Logic Continues!
## What's the idea?
A beginner-friendly summary of the verification: “Conquering Weak Spots: Our Search for Uncorrelated EA Logic Continues!”.
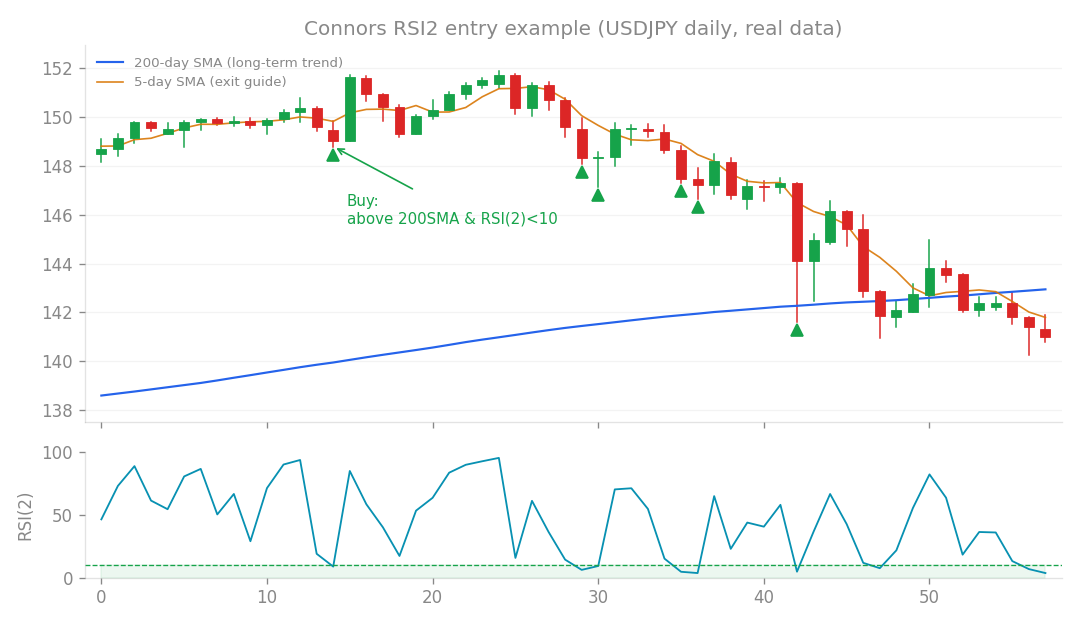
Connors RSI2 entry example (USDJPY daily, real data): buy the dip when price is above the 200-day SMA and RSI(2) falls below 10.
What’s the idea?
Imagine you have a fantastic trading robot, let’s call it v1.5.0. It’s a real star when the market is generally going up, because it combines two powerful strategies: a “Core” strategy that loves long-term trends, and a “Connors Long” strategy that profits from buying dips (mean reversion) in rising markets. Both are “long” strategies, meaning they primarily bet on prices going up. But what happens when the market isn’t going up? What about sideways markets, or even downtrends? That’s where v1.5.0 isn’t as strong. So, the big idea was to find an “uncorrelated sleeve”—a new strategy that could complement v1.5.0, performing well when v1.5.0 doesn’t, especially in falling or ranging markets. Think of it like adding a winter coat to your summer wardrobe; it covers a different season. We wanted something that was uncorrelated with both our Core trend strategy and our Connors Long mean reversion strategy, and crucially, something that showed profit in forward testing.
How I tested it
I took two promising candidates that theoretically could fill this gap and put them through rigorous testing. The goal was to see if they could truly add diversification without just being redundant or, worse, losing money. For each candidate, I looked at a few key metrics:
- Monthly Profit: How much it made (or lost!) on average each month.
- PF (Profit Factor): This is simply gross profit divided by gross loss. A PF greater than 1 means the strategy is profitable overall. For example, a PF of 1.5 means for every $1 lost, the strategy made $1.50.
- Correlation: How much its performance moved in sync with our existing Core and Connors Long strategies. A low correlation (close to 0) is good for diversification; a high correlation means it’s doing the same thing as what we already have. A negative correlation would be even better, as it would profit when our main strategies struggle!
- Forward Validation (Out-of-Sample or OOS): This is crucial. I first optimize and select the strategy using data up to 2015-2020 (this is called “in-sample” data). Then, I test it on completely new, unseen data from 2020-2025. If a strategy only works on the data it was “trained” on, it’s probably just lucky or “overfit” to past conditions. True robustness means it works on new data. Let’s dive into the results!
What happened?
Candidate 1: Bollinger Bands Mean Reversion (Long)
This strategy involved buying dips when prices touched the lower Bollinger Band, expecting them to bounce back up. It’s another type of mean reversion strategy. Here’s what I found:
- Monthly Profit: +0.14% (modest, but positive!)
- PF: 1.63 (pretty good, indicating solid profitability)
- Correlation with Core (long trend): +0.03 (Excellent! Almost no correlation, suggesting good diversification with our trend strategy.)
- Correlation with Connors Long (long mean reversion): +0.45 (Uh oh. This is a problem.) In other words: While this strategy looked profitable and didn’t move much with our main trend strategy, it was highly correlated with our other existing mean reversion strategy (Connors Long). This means it was essentially doing the same job, just in a slightly different way. It didn’t add true diversification; it was redundant. Conclusion: Not adopted. Why add something that just duplicates what we already have? We’re looking for new angles!
Candidate 2: Connors Short Strategy (Selling into rallies during downtrends)
This strategy aimed to profit from falling markets by selling into small rallies. It’s the opposite of our Connors Long strategy, which buys dips in rising markets. This seemed like a perfect fit to cover our “down/range” market weakness! Initially, the full historical test results looked quite appealing:
- Monthly Profit: +0.09% (positive, though small)
- PF: 1.26 (profitable)
- Correlation with Core (long trend): -0.13 (Fantastic! Slightly negatively correlated, meaning it tended to do well when our trend strategy struggled.)
- Correlation with Connors Long (long mean reversion): +0.19 (Low correlation, also good for diversification.) In other words: On paper, this strategy looked like a winner! It was profitable over the long run and seemed to offer excellent diversification, especially against our main trend strategy. But then came the crucial forward validation (OOS 2020-2025):
- PF: 0.87 (A clear loss-maker! Remember, we need >1 to be profitable.)
- Monthly Profit: -0.04% (Losing money every month!)
- Sharpe Ratio: -0.29 (The Sharpe ratio measures risk-adjusted return; a negative value is very bad, indicating poor returns for the risk taken.) In other words: When tested on fresh, unseen data, this promising strategy completely fell apart. The positive results from the full historical period were a classic case of selection bias. It looked good because we selected it based on past data, but it wasn’t robust enough to handle new market conditions. This also reinforced a recurring theme in my research: “shorts are a drag.” Short strategies, especially mean reversion shorts, often struggle to find consistent opportunities and profitability. The market environment from 2020-2025 was largely an upward trend, making it particularly difficult for a strategy designed to profit from falling markets. Conclusion: A clear failure in forward testing. Not adopted.
What I learned
This research journey, though it didn’t yield a new “sleeve,” taught me some very important lessons:
- True diversification is hard to find. It’s easy to find strategies that look good on paper, but finding one that genuinely complements existing robust strategies without being redundant or failing in forward validation is incredibly challenging.
- The existing v1.5.0 is truly exceptional. The combination of our “long trend” (Core) and “long mean reversion” (Connors Long) strategies represents the two most robust edges I’ve found in price action. The Connors Long strategy, in particular, was a rare gem—a real, genuine additional edge found outside of pure trend-following.
- Beware of selection bias. Initial positive results, especially over long historical periods, can be misleading. Forward validation (out-of-sample testing) is the ultimate judge of a strategy’s robustness.
- Short strategies are tough. My research consistently shows that various short strategies, whether trend-following or mean-reversion, often struggle to maintain profitability in forward testing. They tend to be a “drag” on overall performance. For now, our v1.5.0 remains as is—a powerful, focused system for rising markets. We’re not adding anything new at this time. But the search for that elusive uncorrelated sleeve continues! I’ll be looking into other candidates in the future, such as strategies based on TD Sequential or ICT-SMC concepts (which had mixed results in earlier research) and calendar-based expansions. However, I’m tempering my expectations; finding truly robust, uncorrelated edges is a rare feat!
How this connects
This verification builds on earlier ones (what failed before and what I tried this time, comparisons between approaches).