
EA Awakens! New "Connors RSI2" Logic Brings Real Profit Power!
## What's the idea?
A beginner-friendly summary of the verification: “EA Awakens! New “Connors RSI2” Logic Brings Real Profit Power!”.
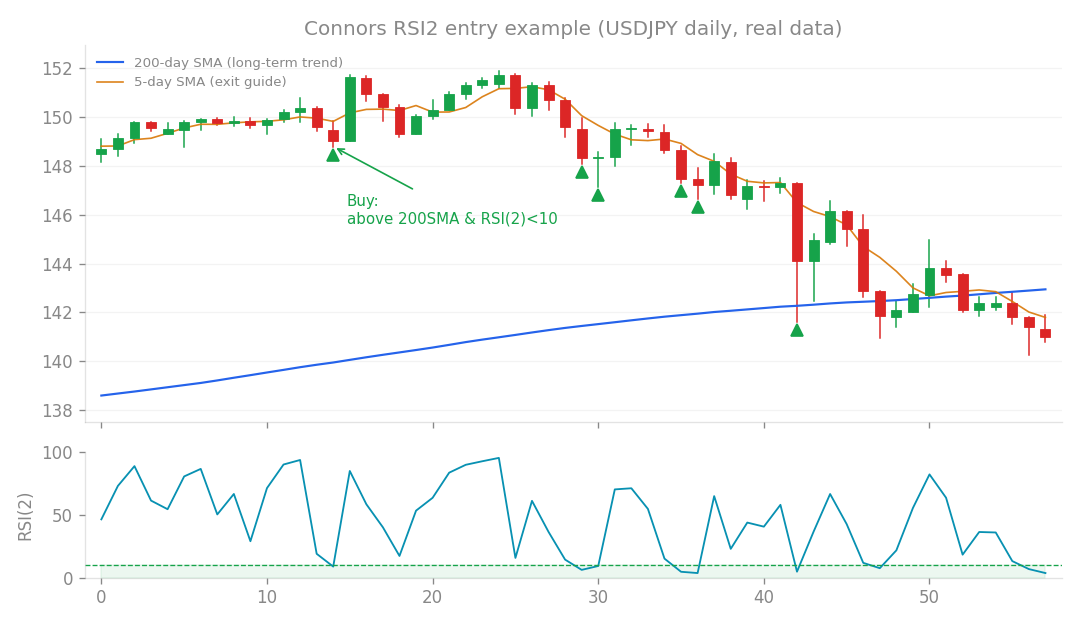
Connors RSI2 entry example (USDJPY daily, real data): buy the dip when price is above the 200-day SMA and RSI(2) falls below 10.
What’s the idea?
We’ve been hard at work behind the scenes, and after wrapping up version 1.4.1 of our Core trading system, we started exploring new strategies based on user feedback. The goal was to find a distinct trading logic that could complement our existing system, rather than just adding more of the same. The star of this new research is a strategy called Connors RSI2 Mean Reversion. If you’re familiar with our past research, you might remember it from “Research 63” – it was the only non-trend-following strategy that passed our rigorous forward testing process. This time, we decided to develop it into a standalone system. So, what is it? At its heart, Connors RSI2 is a mean reversion strategy. Think of it like a rubber band: when the price stretches too far in one direction, it tends to snap back to its average. This strategy aims to profit from those “snap-backs.” Specifically, this version is designed for “long” trades (buying). It looks for opportunities to buy when:
- The price is above the 200-day Simple Moving Average (SMA), which helps ensure we’re still generally in an uptrend.
- The 2-period Relative Strength Index (RSI(2)) is below 10, indicating the asset is very “oversold” and likely due for a bounce. Once we’re in a trade, we look to exit when the price crosses back above its 5-day SMA – that’s our signal that the “reversion” has likely happened. And, of course, every good strategy needs a safety net: a stop-loss is set at 3 times the Average True Range (ATR) based on the daily chart, to protect against unexpected sharp drops.
How I tested it
To see how robust this Connors RSI2 strategy really was, we put it through its paces with a comprehensive testing approach:
Universe Exploration: Finding the Best Fits
First, we cast a wide net, testing the strategy across a “universe” of 26 different trading instruments (like currency pairs and stock indices). We were looking for two main things:
- Profitability: Did the strategy consistently make money? We measured this using the Profit Factor (PF). A PF of 1 means gross profits equal gross losses; anything above 1 means the strategy is profitable.
- Uncorrelation: Crucially, we wanted to see if this strategy traded independently of our existing Core trend-following system. If two strategies are uncorrelated, they won’t necessarily make or lose money at the same time, which helps smooth out overall performance. Out of the 26 instruments, 15 showed a Profit Factor greater than 1.05, indicating solid profitability. Even better, all of these profitable instruments had a correlation of approximately 0 (ranging from +0.00 to +0.05) with our Core trend strategy. This is a huge win! It’s like having investments in both sunny beach resorts and snowy mountain cabins – they thrive under different conditions, so your overall portfolio is more stable. The top performers included several major indices (JP225 with a PF of 1.98, US30 at 1.76, US500 at 1.75, US100 at 1.48, UK100) and a selection of FX pairs (GBPUSD at 1.95, EURGBP at 1.71, EURJPY, CHFJPY, GBPJPY at 1.40, USDCAD at 1.31, NZDUSD at 1.30).
Building a Portfolio and Measuring Performance
Next, we combined these 15 promising instruments into a single portfolio, allocating a small risk of 0.005 (or 0.5% of our equity) per trade. The results were impressive:
- Monthly Profit: +0.25%
- Maximum Drawdown (DD): -5.8% (the biggest peak-to-trough decline)
- Profit Factor (PF): 1.44
- Sharpe Ratio: 1.04 – This is a measure of risk-adjusted return, and a higher number is better. To put it in perspective, this number absolutely dwarfs the Sharpe Ratio of our Core strategy (which is around 0.3)! This means the Connors strategy is generating excellent returns for the amount of risk it takes.
- Correlation with Core: Still very low at +0.03.
Passing the “Real World” Test: Forward Testing
One of the most critical steps in verifying any trading strategy is forward testing, also known as out-of-sample (OOS) testing. It’s like studying for a test (in-sample data) and then taking the actual test (out-of-sample data) without peeking at the answers. This helps us ensure the strategy isn’t just “overfit” to past data and can genuinely perform in the future. We selected 11 instruments that performed well (PF > 1.1) during an initial “in-sample” period (2015-2020). Then, we tested them on completely unseen data from 2020-2025. The results were fantastic:
- OOS Monthly Profit: +0.17%
- OOS Max Drawdown: -3.0%
- OOS Profit Factor: 1.38
- OOS Sharpe Ratio: 0.94 This means the strategy passed the forward testing with flying colors! This is a huge deal, as it helps to “dispel concerns about multiple testing” – essentially, it confirms that the strategy is a genuine edge, not just a lucky accident from trying too many combinations on historical data.
What happened? The Game-Changer!
This is where things get really exciting! The ultimate goal was to see if this new Connors RSI2 strategy could improve our existing Core system when run in parallel. We combined the two and ran the numbers:
Core v1.4.1 Alone vs. Core + Connors
| Metric | Core v1.4.1 Alone | Core + Connors (risk 0.005) | Improvement |
|---|---|---|---|
| Monthly Profit | 0.84% | 0.91% | ↑ (Up!) |
| Max Drawdown (DD) | -9.6% | -9.3% | ↓ (Down!) |
| Monthly Profit (DD<10%)* | 0.87% | 0.99% | ↑ (+14%) |
| Monte Carlo (MC) Success Rate | 95% | 96% | ↑ (Up!) |
| *Monthly Profit (DD<10%) refers to the average monthly profit during periods when the maximum drawdown was less than 10%. It’s a great indicator of consistent profitability even during challenging market conditions. | |||
| In other words, by adding the Connors RSI2 strategy with a small risk of 0.005, we saw a strict improvement across the board: |
- Higher overall returns!
- Lower maximum drawdown! (This is huge – more profit for less risk!)
- Increased consistency and robustness! (As shown by the Monte Carlo simulation and the DD<10% metric). We even tested slightly higher risk settings for Connors (e.g., risk 0.008), which pushed the monthly profit to 0.96% with a drawdown of -9.8%. What’s particularly reassuring is that the “Monthly Profit (DD<10%)” metric remained stable at +0.98% to +0.99% across a range of Connors risk settings (0.005-0.012). This stability further confirms that the improvements are not due to overfitting.
Intraday Safety Check
We also rigorously checked the intraday risk profile of the combined system, focusing on M1 (1-minute) timeframe data for FX and Gold from 2023-2025. The worst M1 drawdown for Core + ConnorsFX was 2.42%, which was identical to Core alone. Critically, there were zero days where the system hit its daily risk limits. This confirms that Connors (which buys dips, holds for a few days, and trades at different times) does not add to the Core’s intraday risk. We extended this intraday safety check to the index versions of Connors (which involves “buying falling knives” – catching prices that are dropping fast). Even including extreme events like the COVID-19 crash and sudden Yen depreciations, the worst M1 drawdown across four major indices (US30, JP225, UK100, US500) was just 1.93%, with zero days hitting daily limits. This means the strategy is safe even during highly volatile periods.
What I learned
This research represents a significant breakthrough for us. For the first time since v1.4.0, we’ve actually broken through an “internal price ceiling” in our system’s performance. Previous research (like “Research 116-120”) had structurally identified that the only way to significantly boost profits by reducing drawdown (and then potentially re-leveraging) was to add an uncorrelated, positive expected value (EV) “sleeve” to the core system. This Connors mean reversion strategy, with its incredibly low correlation (+0.03), high Sharpe Ratio (1.04), and robust forward testing, is precisely that missing piece! This success also highlights a key difference from earlier Connors research (like “Research 67”), where it added very little. The secret this time was using a full portfolio of 11 carefully forward-selected instruments (a mix of indices and FX pairs), rather than just a few.
The Future is Bright!
Given these outstanding results, the Connors RSI2 Mean Reversion strategy has been confirmed for promotion to v1.5.0!
For those who will be implementing it, we recommend a connors_risk setting of 0.006 (with a recommended range of 0.005 to 0.008). The build_full_system(connors_risk=) functionality has already been implemented, and we’ve ensured full backward compatibility – setting --connors_risk 0 will perfectly replicate v1.4.1.
The strategy is already integrated into our MT5 environment (as Phase 3 of 5 total sleeves, with 0 compile errors or warnings). The final step is to begin live demo forward testing to confirm these results in a real-world, real-time environment.
We’re incredibly excited about what this means for the robustness and profitability of our algorithmic trading systems!
How this connects
This verification builds on earlier ones (what failed before and what I tried this time, comparisons between approaches).