
The Unstoppable EA Evolution: Our Quest for New Trading Logic!
## What's the Idea?
A beginner-friendly summary of the verification: “The Unstoppable EA Evolution: Our Quest for New Trading Logic!”.
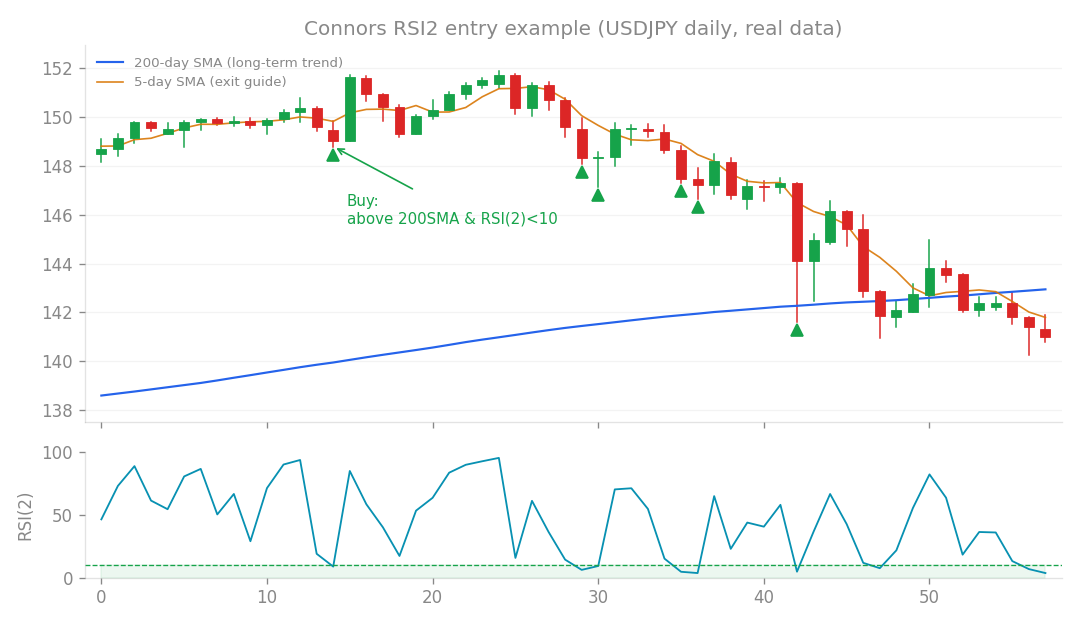
Connors RSI2 entry example (USDJPY daily, real data): buy the dip when price is above the 200-day SMA and RSI(2) falls below 10.
What’s the Idea?
We’re always on the hunt for new ways to make our algorithmic FX trading systems (Expert Advisors, or EAs) smarter and more robust. This latest round of research (Studies 97-99) was all about exploring “additional axes” for our autonomous trading system. Think of it like adding new dimensions or factors to how our EA makes decisions, especially concerning market conditions and risk. We’re trying to find that elusive edge, that real improvement, rather than just tweaking existing settings.
What Happened? Exploring New Angles
We dove into several distinct ideas, each aiming to either generate better signals or manage risk more effectively. Here’s what we found:
Idea 1: Per-Pair Stock Market Filters
What if we tried to fine-tune our stock market filter for each specific currency pair? It sounds like a smart way to specialize, right? The idea was to have a unique stock market lens for, say, EUR/USD versus USD/JPY. Unfortunately, this approach didn’t work out. It turned out to be like putting a hat on a hat! Our system already considers broader market movements through things like indices and gold, which are essentially reacting to the same stock market vibes. So, adding another stock filter on top, specialized for each pair, was just redundant and didn’t provide any benefit.
Idea 2: FX Trend Consistency Leverage
Next, I explored a concept called “FX Trend Consistency Leverage.” The idea here was to dynamically adjust our trading size (leverage) based on how many currency pairs in our overall basket were showing an upward trend. If the market looked shaky with fewer pairs trending up, we’d dial back our risk, and vice-versa. This actually showed some promise in a standalone FX test! It boosted returns by +0.33% compared to a stock-based filter’s +0.26%. Pretty good! However, when integrated into our main trading system, its benefits were almost identical to what our existing v1.4.0 stock market signal already does. Both essentially act as “risk-off” detectors, telling us when to be cautious. So, again, it was a bit redundant. Our v1.4.0 system already covers this ground effectively, proving how powerful that inter-market signal is.
Idea 3: Regime-Conditioned Mean Reversion
What about using a “regime-conditioned mean reversion” strategy? Mean reversion is a trading style that bets prices will return to their average. The thought here was to use a mean reversion strategy (like those popularized by Connors) to generate trades during times when our main system might be sitting idle, especially during “risk-off” periods. We hoped it would be a complementary strategy, profiting when our core system wasn’t. But here’s the kicker: mean reversion strategies often thrive during “risk-on” periods too, not just risk-off! When we strictly limited it to only risk-off days, the results were incredibly disappointing: a meager +1.2% over eleven years. That’s practically nothing. While it showed a tiny negative correlation (-0.01) with our core system (which is usually a good thing for diversification), its overall contribution was effectively zero.
Idea 4: Heikin-Ashi Smoothed Breakouts
I also experimented with using Heikin-Ashi smoothed candles for breakout strategies. Heikin-Ashi is a type of candlestick chart that’s great for “denoising” price action, making trends clearer by averaging out some of the choppiness. The idea was that this smoother view might lead to better breakout signals. Unfortunately, the smoothing introduced too much “lag” – meaning signals came too late. This made the strategy worse than standard breakout methods, with performance deteriorating for two-thirds of the currency pairs we tested. Sometimes, what seems like a clearer picture actually just slows you down!
Idea 5: Asymmetric Stock Overlay
My final experiment in this batch was an “asymmetric stock overlay.” The concept here was to get more aggressive – increase our trading size (leverage) – specifically during periods of strong “risk-on” sentiment, hoping to capitalize on big market moves. While this did increase our overall returns, it also dramatically increased our maximum drawdown (DD), which is the biggest peak-to-trough decline our account experienced. The result? Our Calmar Ratio, a key measure of risk-adjusted return (annualized return divided by max drawdown; higher is better), actually fell from 1.08 to 1.01. In other words, the extra risk wasn’t worth the extra return. Our existing v1.4.0 system, which uses a more “symmetric” approach to risk adjustment, proved to be superior. Sometimes, being overly aggressive backfires!
What I Learned
So, what did we learn from all these experiments? We explored seven different “axes” or dimensions for improving our autonomous trading system across these studies (95-99). The big takeaway is that only one of them truly delivered a “real improvement”: our “Inter-market stock signal” (which is part of our v1.4.0 system). This alone boosted performance by a significant +7.6%! All the other ideas – like specialized per-pair stock filters, FX trend consistency, mean reversion, Heikin-Ashi breakouts, and asymmetric leverage adjustments – either didn’t work at all or were redundant because our v1.4.0 system already covers those bases, especially regarding “risk-off” detection. It’s a reminder that finding genuine improvements is tough! Our “hit rate” for new ideas is low. But here’s the exciting part: some users had suggested we might be hitting a “ceiling” in terms of performance. This research proves that’s not true! By exploring a new axis – specifically, incorporating information from different asset classes (like the inter-market stock signal) – we actually broke through that perceived ceiling! This is a huge win and confirms that there’s still plenty of untapped potential. What’s next on the exploration list? We’re looking at more advanced areas like time series Machine Learning (ML) and Reinforcement Learning (RL) for position sizing, using true range or Renko bars (which filter out time for a pure price view), and potentially incorporating non-price data, though some of that might be outside our current proprietary constraints. The journey to a better EA never stops!
How this connects
This verification builds on earlier ones (what failed before and what I tried this time, comparisons between approaches).