
Are Popular Indicators Always King? What Our EA Test Revealed!
We often get questions about popular technical indicators like the Relative Strength Index (RSI), Simple Moving Averages (SMA), and Fibonacci retracem
A beginner-friendly summary of the verification: “Are Popular Indicators Always King? What Our EA Test Revealed!”.
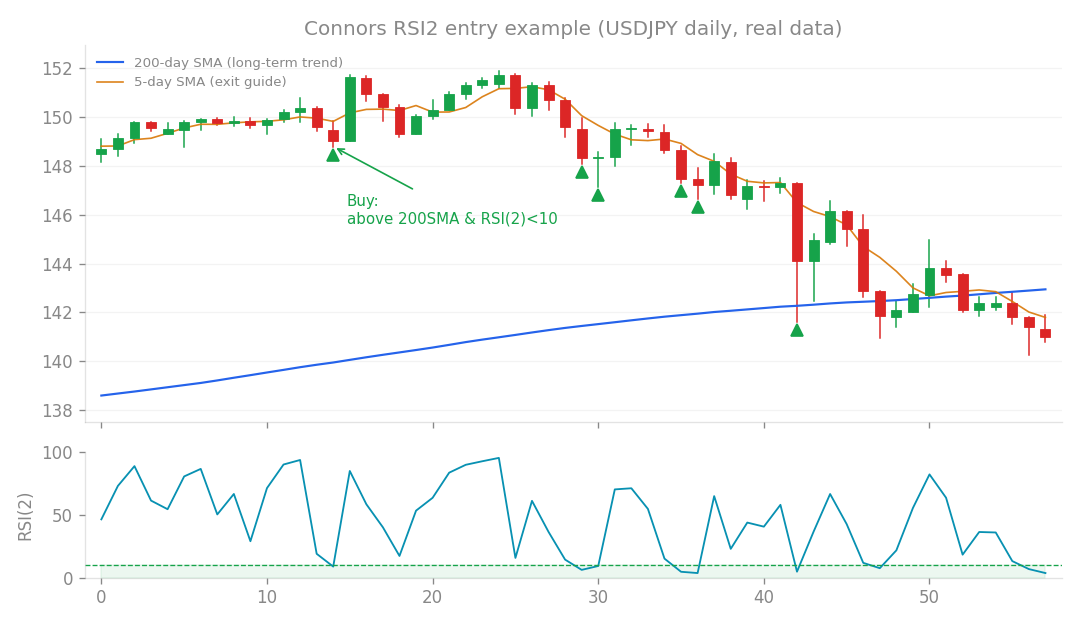
Connors RSI2 entry example (USDJPY daily, real data): buy the dip when price is above the 200-day SMA and RSI(2) falls below 10.
We often get questions about popular technical indicators like the Relative Strength Index (RSI), Simple Moving Averages (SMA), and Fibonacci retracements. Are they hidden gems just waiting to be uncovered? Can they give us a standalone trading edge, or at least supercharge our existing algorithmic trading systems (EAs)? That’s exactly what we set out to investigate in this research!
What’s the idea?
Many traders swear by indicators like RSI, SMA, and Fibonacci levels. They’re fundamental tools in manual trading, and it’s natural to wonder if they can be integrated into an EA for better performance. Our goal was twofold:
- Can they work as standalone trading strategies? Imagine an EA that only trades based on Fibonacci pullbacks or RSI signals.
- Can they act as filters for our existing core system? A common thought is, “Maybe they don’t work alone, but what if they just confirm or refine entries for an existing strategy?” We specifically looked into this, especially for our
BreakoutLonglogic. Let’s dive into what we found!
Testing Them as Standalone Strategies
First, we put these indicators to the test as independent trading strategies.
The Fibonacci Retracement Pullback
We developed a strategy called FibPullback, designed to buy on pullbacks to key Fibonacci retracement levels within an uptrend.
- The Good News: This strategy passed 5 out of 6 forward tests. In trading terms, “forward testing” means running a strategy on fresh, unseen market data, simulating real-world conditions. Passing 5 out of 6 is a strong sign, indicating a genuine trend-following edge!
- The Catch: When we looked at its “core correlation” – how much its trades aligned with the underlying logic of our existing core system – it was very high, between 0.82 and 0.86. A correlation of 1 means they move perfectly together. This high correlation meant
FibPullbackwasn’t discovering anything truly new; it was essentially “rediscovering” trends that our core system already identified. - The Profit Factor (PF): The
FibPullbackstrategy had a Profit Factor (PF) of 1.13-1.14. The Profit Factor is calculated as Gross Profit divided by Gross Loss; anything above 1 means the strategy is profitable. While 1.13-1.14 is profitable, it’s lower than our core system’s PF. In other words:FibPullbackis like finding a slightly different path to a gold mine you already own. It’s a real path, but it doesn’t lead to a new mine, nor is it significantly more efficient than your current route. It offered no real novelty or diversification value for us.
The RSI (Connors Variant)
Next, we explored a Connors variant of the Relative Strength Index (RSI). RSI is a momentum oscillator, telling you if a stock or currency is overbought or oversold.
- The Promising Bit: This RSI variant showed a very low correlation (0.18) with our core system. This is exciting because low correlation suggests it might offer true diversification – a unique way of looking at the market that isn’t redundant.
- The Disappointment: Unfortunately, when tested specifically for FX markets, this strategy either lost money or made only very small profits. This aligns with what we’ve seen in previous research (studies 63 and 67). In other words: The RSI was unique, but not profitable enough to be useful on its own. It’s like finding a unique key, but it doesn’t open any doors to treasure.
Fibonacci + RSI Combo
We also tried combining Fibonacci with RSI for confirmation. While this brought the correlation down to 0.42, the trading “edge” – the statistical advantage that makes a strategy profitable – completely disappeared.
Can They Work as Filters? Testing on a “Naked” Breakout
This is where many traders have hope. Even if indicators don’t work alone, surely they can improve an existing strategy by filtering out bad trades, right? We put this to the test by adding RSI and SMA slope filters to a basic, “naked” BreakoutLong strategy. A “naked” strategy is one without any fancy filters or optimizations, just the raw entry logic.
- SMA Upward Slope Filter: We added a filter that only allowed trades when the Simple Moving Average (SMA) was sloping upwards, indicating an uptrend.
- The Result: This was a clear win for the naked strategy! The basic
BreakoutLongpassed 3 out of 6 forward tests. With the SMA 10/20 period slope filter, that jumped to 5 out of 6! Even with longer 30/40 period slopes, it improved to 4 out of 6, always outperforming the unfiltered version. - RSI Filter: We also tried filtering trades based on RSI being below 70 or 75, suggesting the market wasn’t excessively overbought.
- The Result: This also improved the naked strategy, passing 4 out of 6 forward tests. In other words: Yes, these indicators absolutely can improve a basic, unfiltered trading strategy! It’s like putting performance tires on a basic car – you’ll definitely see an improvement in handling.
The Ultimate Test: Integrating into Our Core System v1.3.1
This was the big one. We saw that these indicators could make a basic strategy better. Now, what happens when we try to integrate them into our already advanced, highly optimized Core System v1.3.1?
We meticulously added the rsi_min, rsi_max, sma_slope_n, and sma2_n filters to our core system and ran extensive tests. Here’s what we found:
- Monthly Profit: Slightly dipped from +0.81% to +0.77%.
- Drawdown (DD): Slightly improved from -9.5% to -9.3%. Drawdown is the peak-to-trough decline in your account, so a smaller DD is better.
- Profit Factor (PF): Slightly improved from 1.57 to 1.62.
- Market Correlation (MC): Remained unchanged at 94%. The undeniable conclusion: There was no clear improvement! Despite the individual components showing promise, their impact on the sophisticated core system was negligible.
Why Didn’t It Work? The Bottleneck Effect
This might seem counterintuitive. If these filters work on a basic strategy, why not on an advanced one? The answer lies in the concept of a “bottleneck.” Our core system is already highly optimized. It uses:
- Multi-Timeframe (MTF) Diversification: Trading across different timeframes (e.g., 1-hour, 4-hour, daily) to capture various market dynamics and spread risk.
- Volume Targeting: Dynamically adjusting position sizes based on market volatility and available capital, ensuring consistent risk per trade.
- Robust Risk Management: A comprehensive approach to managing risk across all trades. In other words: The “bottleneck” (the part that limits overall performance) of our core system is no longer about the quality of individual trade entries. It’s already so robustly managed through diversification and risk control that simply refining entry signals with standard indicators doesn’t move the needle. It’s like trying to make a Formula 1 race car faster by polishing its hubcaps. Or, trying to improve the water pressure in a house that already has a state-of-the-art plumbing system by fixing a slightly leaky faucet. The overall system is already so efficient that minor tweaks to a non-bottleneck component won’t yield significant gains. As previous research (studies 51 and 86) showed, “improving a non-bottleneck component doesn’t help.”
What I Learned (The Big Takeaways)
This research, like studies 87 and 93, reinforces a crucial lesson:
- Standard indicators like RSI, SMA, and Fibonacci retracements are either:
- “Rediscovering” existing market trends when used as standalone strategies (high correlation).
- Effective at improving basic, unfiltered trading strategies.
- But they do not significantly improve an already sophisticated and optimized system that relies on multi-timeframe diversification and volume-targeted risk management.
Our research consistently shows that for a mature EA like ours, the “ceiling” of performance is largely set by its advanced diversification and risk management techniques, not by refining basic entry signals with standard indicators.
Therefore, our core system will remain unchanged. However, the
FibPullbackstrategy and the various filter functions we developed are valuable “permanent assets” that we’ll keep in our toolkit for future research and exploration. Who knows, they might find their perfect niche in a different context down the line!
How this connects
This verification builds on earlier ones (what failed before and what I tried this time, comparisons between approaches).