
Unleashing the Beast: The Secret Behind Core v1.3's Evolution!
## What's the Idea?
A beginner-friendly summary of the verification: “Unleashing the Beast: The Secret Behind Core v1.3’s Evolution!”.
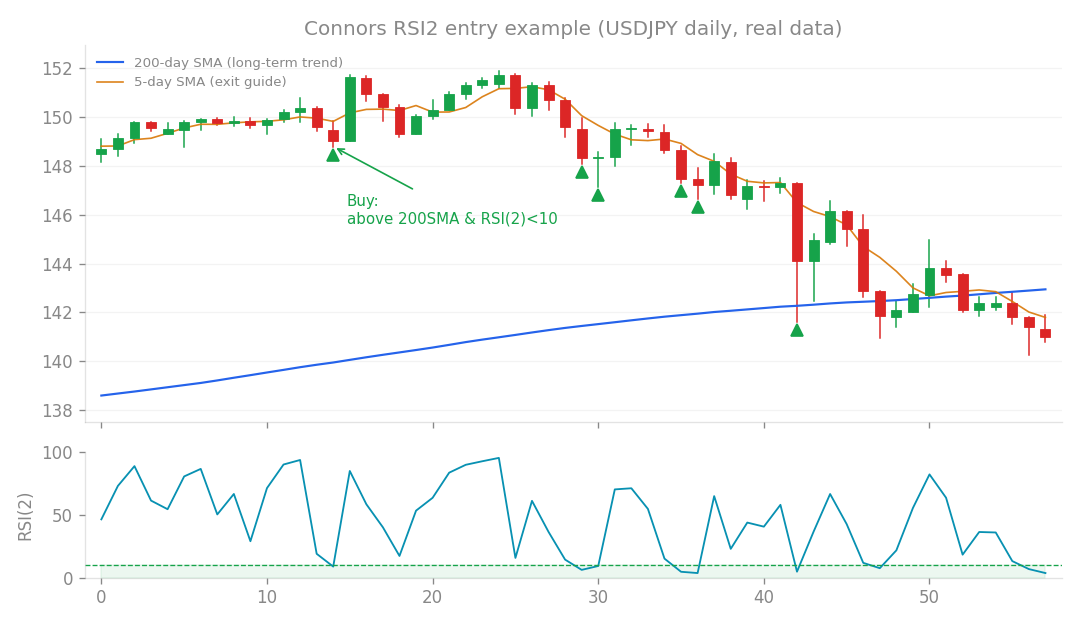
Connors RSI2 entry example (USDJPY daily, real data): buy the dip when price is above the 200-day SMA and RSI(2) falls below 10.
What’s the Idea?
We’re always looking for ways to make our algorithmic trading systems, or EAs, perform better and more reliably. This time, we focused on “Core v1.3” – a robust EA we’ve been refining. The goal wasn’t just to make it more profitable (anyone can do that by taking on more risk!), but to find real enhancements that improve its efficiency and stability, making it a genuinely better system. Think of it like tuning a car engine – we want more power and better fuel economy, not just slamming the accelerator. Our EA uses a modular design, meaning it has different “sleeves” or components working together. We wanted to see if tweaking these, or adding new ones, could bring a noticeable, verifiable improvement.
How I Tested It
To ensure a fair comparison, all tests were run at a specific “operating point”: a maximum historical Drawdown (DD) of -15% with a 1.8x leverage.
- Drawdown (DD): This is the peak-to-trough decline in an investment, account, or fund during a specific period. A -15% DD means the account value dropped by 15% from its highest point before recovering. Keeping this consistent helps us compare apples to apples. We examined three specific ideas for enhancing Core v1.3:
- Increasing
vt_cap: This refers to the “volatility target cap.” Our EA dynamically adjusts its position size based on market volatility. Thevt_capputs a limit on how much it can adjust. The idea here was to give the system a bit more freedom by raising this cap. - Adding “Connors”: This likely refers to incorporating a new trading strategy or indicator set, perhaps based on the well-known Connors trading principles. The hope was to introduce new angles for profit.
- Extending
vol-targettosat2(Satellite 2): Our system has a main “Core” and supporting “Satellite” strategies.vol-targetmeans each strategy aims for a specific level of volatility in its returns, adjusting position size accordingly. We wanted to see if applying thisvol-targetlogic specifically to our second satellite strategy (sat2) would help.
What Happened?
Let’s break down the results for each candidate:
1. vt_cap Increase: Mostly Neutral, but a Tiny Win
We raised the vt_cap to 3.0. The results were largely neutral, meaning no dramatic changes. However, we did see a slight reduction in drawdown and a small drop in the “failure rate” (which measures how often a strategy might lead to a significant loss). Specifically, the failure rate went from 6.8% to 6.4%. So, not a game-changer, but a small positive step toward stability.
2. Adding “Connors”: More Risk, Not More Efficiency
This one looked promising at first glance! Adding Connors did increase monthly profit. But here’s the kicker: the Drawdown (DD) increased even more proportionally. This led to a decrease in the Calmar Ratio (from 0.93 to 0.77).
- Calmar Ratio: This is a risk-adjusted return metric. It’s calculated as the annual return divided by the maximum drawdown. A higher Calmar Ratio means better returns for the amount of risk taken. In other words, while the EA made more money, it did so by taking on disproportionately more risk. This isn’t a true enhancement; it’s like pressing the accelerator harder without making the engine more efficient. It just means you’re burning more fuel for that extra speed, and possibly risking a crash! So, this was not adopted.
3. Extending vol-target to sat2: A Real, Small Improvement!
This was the star of the show! Applying the vol-target mechanism to our sat2 (Satellite 2) strategy yielded a genuine, albeit small, improvement.
Why was this a “real” improvement? Because it tackled a specific “bottleneck.” We observed a 0.54 correlation between our main “Core” strategy and sat2. By giving sat2 its own vol-target, we effectively managed the risk contribution of this component more precisely.
Here’s what we saw:
- Overall Profit: Increased from 1.10% to 1.16% (a nice bump!).
- Failure Rate: Decreased from 6.8% to 6.1%.
- Monte Carlo (MC) Success Rate: Improved.
- Monte Carlo Simulation: This is a powerful technique that runs thousands of hypothetical scenarios to estimate the probability of different outcomes. A higher MC success rate means the strategy is more robust across a wide range of potential market conditions.
- Drawdown (DD): Remained stable. This is exactly what we want: more profit, less risk, and greater robustness, all without increasing the overall drawdown.
The New & Improved v1.3.1!
Based on these findings, we’ve officially adopted a new version: Core v1.3.1. The enhancements included are:
sat2 vol-target: Extending the volatility targeting to our Satellite 2 strategy.vt_cap3.0: Raising the overall volatility target cap to 3.0. Let’s look at the combined impact of these changes on our baseline operating point:- Monthly Profit: Jumped from 0.71% to 0.79% – a solid +11% increase!
- Profit Factor (PF): Improved from 1.48 to 1.57.
- Profit Factor (PF): This is the ratio of gross profit to gross loss. A PF greater than 1 means the system is profitable. A higher PF indicates greater efficiency in generating profits relative to losses.
- Monte Carlo (MC) Success Rate: Rose from 93% to 94.3%.
- Drawdown (DD): Moved slightly from -8.8% to -9.5%, which is still comfortably within our acceptable -10% target for this specific test.
- Another metric, M1, showed a 2.79% improvement over a very short period, reinforcing the positive shift.
We’ve also ensured that this update is backward compatible, meaning you can still revert to the v1.2.0 behavior if needed (by using a
--no_vol_targetflag). This shows our commitment to careful, verifiable development.
What I Learned
The key takeaway from this research is that extending the vol-target mechanism to all components (or “sleeves”) of the EA, combined with a slightly wider vt_cap, represents the last significant “small, real improvement” we can achieve with the current architecture.
Other ideas we’ve explored, like adding “Connors” or the “index regional diversification” from Research 87, ultimately didn’t provide true, risk-adjusted improvements. This suggests that Core v1.3.1 effectively hits the ceiling for enhancements based on diversification and volatility targeting within its current framework.
So, where do we go from here for further gains? The path forward likely involves more complex aggregated vol-target strategies (which we’ve put on hold due to their complexity) or, more interestingly, incorporating external, non-price data into our decision-making. That’s a whole new frontier for future research!
For now, Core v1.3.1 gives us a more robust, efficient, and profitable system, without taking on undue risk. Small tweaks, big impact!
How this connects
This verification builds on earlier ones (what failed before and what I tried this time, comparisons between approaches).