
Decoding the Market: Finding the Best Logic and Realistic Monthly Profits!
## What's the idea?
A beginner-friendly summary of the verification: “Decoding the Market: Finding the Best Logic and Realistic Monthly Profits!”.
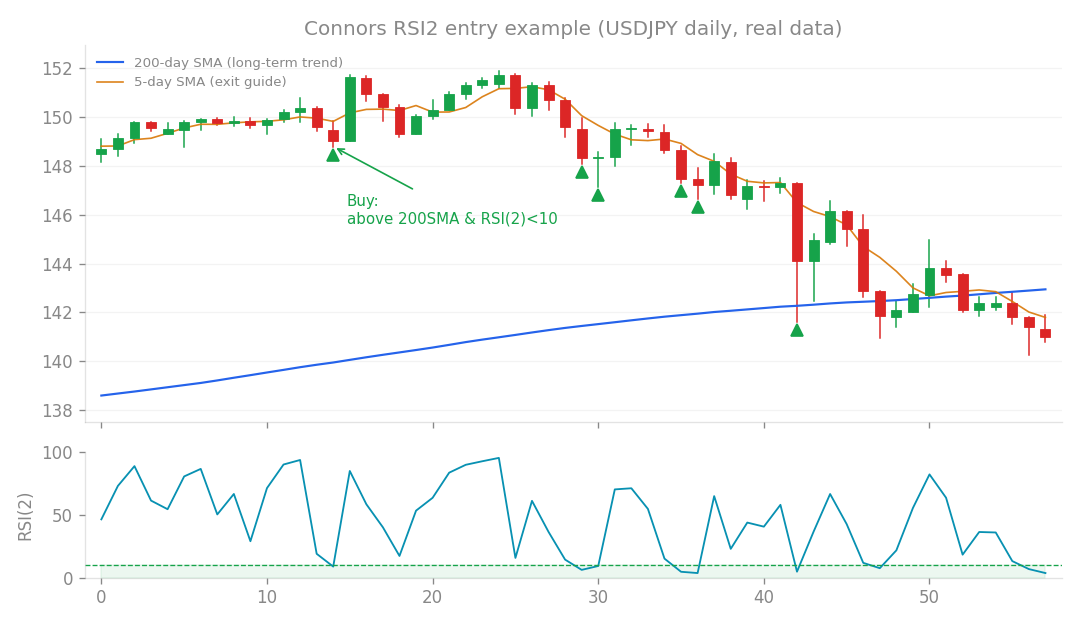
Connors RSI2 entry example (USDJPY daily, real data): buy the dip when price is above the 200-day SMA and RSI(2) falls below 10.
What’s the idea?
We’re always on the hunt for better ways to make our algorithmic trading systems (EAs, or Expert Advisors) more profitable and robust. This time, we dove deep into two big questions:
- What strategies are actually working in the current market conditions? Markets change, and what worked yesterday might not work today. We wanted to identify the prevailing “regime” – like the current weather pattern in the market – and see what kinds of trades it rewards.
- Can we truly hit ambitious monthly profit targets, like 4% with a manageable 10% drawdown? (Drawdown, or DD, is the peak-to-trough decline in your account balance – basically, how much your account has dropped from its highest point.) This is a common goal for many traders, but is it actually realistic for an automated system? And as a bonus, we explored a new approach: creating specialized systems for each currency pair, rather than trying to fit one strategy across everything.
How I tested it
To answer these questions, I ran two major research studies, Research 91 and 92.
Research 91: Hunting for Current Market Trends
For this, I used a technique called “predictive holdout.” Think of it like this: I trained my systems on historical data from 2017 to 2023. Then, I tested them on completely unseen data from 2024 to 2026. This isn’t live trading, but it helps simulate how a system might perform in the immediate future, based on recent market behavior. It’s like studying for a test using old exams, then taking a new one. I looked for patterns in what the market was rewarding during this recent period.
Research 92: Building a “Per-Pair Specialized” System
This was the exciting part! Instead of trying to force one type of strategy (an “archetype”) onto all currency pairs, I decided to customize. For each individual pair (like Gold or USDJPY), I trained and selected the best-suited strategy archetype. For example, some pairs might do well with trend-following, while others prefer mean reversion (strategies that bet on prices returning to an average). Once I found the optimal archetype for several pairs, I bundled nine of the best-performing ones together into a single, cohesive system. I then tested this combined system on “out-of-sample” (OOS) data from 2022 to 2026 – meaning data it had never seen during its training process. This is crucial for verifying if a system truly works, or if it’s just been “overfit” to past data.
What happened?
Let’s break down the findings, starting with what the market is currently favoring, then the reality of profit targets, and finally, the results of our new specialized system.
The Current Market Regime: What’s Working Now?
Research 91 gave us a clear picture of what’s been rewarded in the recent past (and likely continues to be):
- Gold (XAUUSD) has been a superstar! Strategies that went “long” (bought) gold showed impressive returns, with a +38.5% gain and a Profit Factor (PF) of 2.19. (A Profit Factor above 1 means your gross profits are greater than your gross losses – the higher, the better!)
- Japanese Yen (JPY) crosses have also done well on the long side. This means pairs like USDJPY, EURJPY, AUDJPY, and CADJPY, where you’re effectively betting on the JPY weakening.
- The flip side? Most other USD-related pairs (excluding USDJPY) actually failed. This strongly suggests we’ve been in a “weak JPY” and “strong gold” market regime.
The Hard Truth About Monthly Profit Targets
This was a major reality check. We rigorously tested the possibility of achieving a 4% monthly profit with only a 10% drawdown (DD) using four different approaches:
- Simply increasing leverage on our existing Core v1.3.0 system: This didn’t work. While it could push monthly profits higher, it came with a devastating cost – drawdowns soared to over 50%! Even with 6 times the leverage, monthly profit only reached 2.33% with a painful 40% drawdown. This highlights “volatility drag,” where increased risk doesn’t linearly translate to increased profit, especially if you hit big losing streaks.
- A basket of recently performing strategies: This got closer, but still resulted in about 22% drawdown to hit 4% monthly. Too high.
- The per-pair specialized system (in its best-case scenario): Even this promising new system could only achieve 4% monthly with a drawdown of 18-20% during favorable market regimes. Over a full, varied market cycle, it simply couldn’t sustain this target within the 10% drawdown limit.
- Adding “volatility targeting” to strategies: This technique aims to adjust position sizes based on market volatility, but it didn’t improve our situation. The conclusion is stark: A consistent 4% monthly profit with a strict 10% drawdown appears to be unattainable with legitimate, robust systems. We looked at the Calmar Ratio (annual return divided by maximum drawdown), which is a great measure of risk-adjusted return. While good market regimes might see a Calmar Ratio of around 2.5, and an overall period around 1.4, hitting 4% monthly with 10% DD would require an unheard-of Calmar Ratio of 4.8. Such a system simply doesn’t exist – and we refuse to create “fabricated” systems that look good on paper but fail in reality.
Research 92: The Power of Specialization – A Breakthrough!
This is where things got really exciting! The per-pair specialized system clearly outperformed a “one-size-fits-all” approach. By carefully selecting the best strategy archetype for each of the nine selected pairs, we built a truly optimized system. Here’s what made the cut:
- Gold (XAUUSD), CADJPY, US100 (Nasdaq), US30 (Dow Jones): These pairs thrived with an “ATRcandle long” strategy, which is a trend-following approach based on the Average True Range (a measure of market volatility).
- USDJPY: This pair performed best with a “Donchian” strategy, a classic trend-following system that uses channel breakouts.
- EURJPY, GBPNZD, US500 (S&P 500), JP225 (Nikkei): These pairs favored a “ConnorsRSI2” strategy, which is a mean-reversion approach (betting on prices returning to their average) using the Relative Strength Index. The results for this combined system, tested out-of-sample from 2022-2026, were fantastic:
- Monthly Profit: +1.78%
- Maximum Drawdown (DD): -7.8%
- Sharpe Ratio: 2.46 (This tells us how much return we get for the risk we take – higher is better!)
- Monte Carlo (MC) Reliability: 97% (Meaning, if we ran simulations many times, 97% of them would show similar or better results).
- Margin Call Collisions (M1): 0 days (No risk of hitting margin call issues during this test period).
In other words, this system delivered about 2.5 times the monthly profit of our robust Core v1.3 system (which averages 0.7% monthly), while still keeping drawdowns well within our 10% target! This is a significant achievement and has led to the formal development of
perpair_system.py(v0.1.0).
A Crucial Warning: This System Rides the Current Wave!
While the per-pair system is powerful, it comes with an important caveat:
- Its stellar performance is largely driven by Gold and USDJPY, which have shown exceptional Calmar Ratios (around 10 for Gold in OOS!).
- The 10% drawdown compliance is limited to the current market regime. If we look at a longer period (2015-2026), which includes weaker market conditions, the drawdown actually increases to -14.9% (exceeding our 10% target) while monthly profit drops to around 1.1%.
- It’s vulnerable to regime shifts. If the market shifts to a strong JPY or falling gold prices, this system could struggle.
- Less robust overall. This system is designed to “aggressively ride the current regime,” making it less robust across all market conditions compared to our Core v1.3. Therefore, active management is essential. This system requires ongoing “regime monitoring” (keeping an eye on what the market is doing) and an annual re-selection of pairs and strategy archetypes.
What I learned
This research has given us clarity on both the limits of what’s possible and exciting new opportunities:
Positioning Our Systems
- Core v1.3.0 remains our workhorse: This system is built for long-term robustness and consistent withdrawals, aiming for around 0.7% monthly with a 9% drawdown across all market conditions. It’s the stable foundation.
- The new
perpair_systemis our aggressive second option: This system is designed to capitalize on the current market regime, aiming for around 1.8% monthly with an 8% drawdown (in the current regime). It’s for when you want to lean into prevailing trends, but with the understanding that it requires more active oversight. - The 4% monthly profit target remains unrealistic within a 10% drawdown limit. We must be honest about this. However, the fact that we’ve increased our realistic maximum within the 10% drawdown from 0.7% to approximately 1.8% is a genuine and significant achievement!
The Gold Question: Too Good to Be True?
A user asked about focusing solely on Gold (XAUUSD) due to its high Profit Factor. Here’s what we found:
- While Gold’s “ATRcandle long” strategy showed a high OOS Profit Factor of 1.70 in the per-pair system, a large portion of this came from the “contaminated” 2024-2026 data (meaning, it overlapped with the predictive holdout period in Research 91, which can sometimes inflate results).
- When we looked at clean data from 2015-2024, Gold’s standalone performance was still profitable (PF 1.26, +0.66% monthly), but its drawdown was huge at -18.5%. This aligns with a previous “contamination warning” from Research 18.
- Focusing solely on Gold creates massive drawdown risk. To keep Gold’s drawdown within a 10% limit, you’d have to reduce risk so much that its monthly profit would drop to around 0.4% – making it worse than both our Core and per-pair systems!
The takeaway: Gold’s high Profit Factor is incredibly valuable, but only as a leading component within a diversified basket of assets. Concentrating solely on Gold is not recommended due to its dependence on sharp, potentially unsustainable rallies, concentrated tail risk (big, sudden losses), and a complete loss of diversification benefits. Our current diversified setup for the per-pair system is the correct way to leverage Gold’s strength.
This research reinforces our commitment to transparency, realism, and continuous improvement in algorithmic trading. We’re excited about the
perpair_systemas a powerful new tool, used wisely alongside our robust core strategy.
How this connects
This verification builds on earlier ones (what failed before and what I tried this time, comparisons between approaches).