
YouTube's Granville Law: Our EA Test Found No Edge!
Have you ever stumbled upon a YouTube video promising to unlock the secrets of FX trading with a simple indicator? Many of us have! This time, we put
A beginner-friendly summary of the verification: “YouTube’s Granville Law: Our EA Test Found No Edge!”.
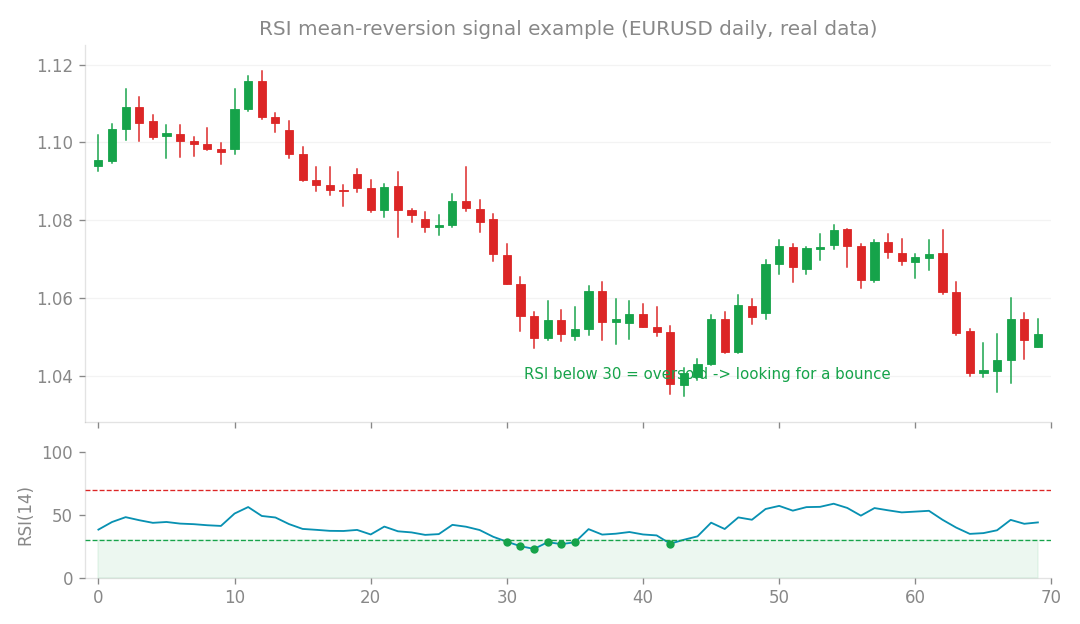
Mean-reversion (RSI) signal example (EURUSD daily, real data): look for a bounce when RSI is oversold.
Have you ever stumbled upon a YouTube video promising to unlock the secrets of FX trading with a simple indicator? Many of us have! This time, we put a popular strategy based on Granville’s Law and the 200-period Exponential Moving Average (EMA) to the test. The specific goal? To reliably catch the elusive “Wave 3” in a trend.
What’s the idea?
The YouTube series we looked at, known for its clear explanations, focused on a core concept: when the market is in an uptrend, price often pulls back to the 200 EMA. The strategy then looks for a signal—either a re-cross (price moving back above the EMA) or a bounce (price touching the EMA and then reversing upwards with a bullish candle)—as the potential start of a strong “Wave 3” move. Granville’s Law, for those new to it, describes how price interacts with a moving average. It gives signals based on price crossing or bouncing off the MA, and how far price deviates from it. The 200 EMA is a widely used long-term trend indicator, so it makes sense to build a strategy around it. However, here’s the kicker: the video itself admitted that the real magic behind its success wasn’t just the EMA. It was the subjective Elliott Wave recognition – essentially, a human eye interpreting complex price patterns. The 200 EMA was more of a helper than the main event. This immediately tells us that mechanizing this strategy might be tricky!
How I tested it
To verify this strategy independently, I built an Expert Advisor (EA) called GranvilleEma. My goal was to take the core mechanical parts of the YouTube strategy and turn them into concrete rules. Since directly programming “subjective Elliott Wave recognition” is, well, subjective, I approximated it by looking at the EMA’s slope. A rising EMA suggests an uptrend, for example.
I implemented three distinct modes based on the strategy’s core ideas:
- Recross Mode (Buy 2): This looked for an uptrend (EMA sloping upwards) where the price dipped below the EMA and then re-crossed back above it. Think of it like a spring coiling and then releasing.
- Bounce Mode (Buy 3): This targeted situations where price touched near the EMA and then immediately reversed with a bullish candle, suggesting a strong support bounce.
- Deviation Mode (Buy 4): This was a counter-trend approach. It looked for price that had moved far away from the EMA, expecting it to revert back to the average. This is a classic “mean reversion” idea.
I tested both
allow_long(buy trades) andallow_short(sell trades) variations. Crucially, I ensured there was absolutely no “leakage” or look-ahead bias in the code. This means the EA only used information available at the time of the trade, making the test fair and realistic.
What happened?
My testing followed a rigorous two-step process:
Step 1: In-Sample (IS) Testing
First, I ran the EA on a diverse set of historical data (7 variations on H4 timeframe) that it had seen before. This “in-sample” test helps us see if the strategy had any historical edge. The results were a bit of a letdown: all variants showed a Profit Factor (PF) of roughly 0.96 to 1.01. What’s a Profit Factor (PF)? It’s calculated by dividing your total gross profit by your total gross loss. A PF greater than 1.0 means your strategy was historically profitable. A PF of 1.0 means you broke even. So, a PF between 0.96 and 1.01 essentially means that even on historical data, these strategies were barely breaking even – or even losing a tiny bit. In other words, there was almost no “edge” present even in the data it was trained on. This was our first red flag!
Step 2: Full Forward Testing (Out-of-Sample)
Next, and this is where the rubber meets the road, I performed a full forward test. This means running the strategy on data it had never seen before (out-of-sample, OOS) to see if it could genuinely perform in new market conditions. This includes selecting the best configurations from the IS tests. Here’s what we found:
- Recross Mode (Long trades only): This variant managed a +5.6% return, but it only passed 4 out of 6 of our robustness checks. While positive, this fell short of our criteria for a truly robust strategy (which usually requires 5/6 or better). Given its near-break-even PF in the in-sample test, this small profit was likely just riding a general market uptrend, not demonstrating a true, consistent edge of its own.
- Bounce Mode (Long trades only): Similarly, this yielded a +5.1% return, also passing only 4 out of 6 robustness checks. Again, this suggests it was probably benefiting from market drift rather than a reliable strategy edge.
- Both Long & Short versions: When we allowed both long and short trades across all modes, the robustness dropped further, with only 3 out of 6 checks passing.
- Deviation Mode (Counter-trend): This was the most dramatic result. The counter-trend strategy resulted in a -25.4% loss and passed a dismal 2 out of 6 robustness checks. This was catastrophic! This result consistently confirms what we’ve seen in previous research (Studies 7 and 8): trying to pick tops and bottoms against strong trends (mean reversion from large deviations) is incredibly challenging and often leads to significant losses.
What I learned
The conclusion is clear: the mechanical core of this Granville (200 EMA) strategy, as derived from the YouTube video, does not possess a robust forward edge. Even the seemingly “best” long-only versions that showed a small profit in forward testing only passed 4 out of 6 robustness checks. This meager profit was primarily due to an overall upward drift in the market during the testing period. It wasn’t the strategy generating profit, but the market moving favorably – a crucial distinction! This reconfirms our earlier findings about the strong correlation between profit and simply following the prevailing trend. The counter-trend “deviation” approach, as expected, was a complete disaster. Trying to fade strong moves is a high-risk game without a very specific and strong edge. The biggest takeaway here, and it’s a recurring theme, is that the subjective Elliott Wave recognition – the part the YouTube video itself highlighted as difficult to mechanize – was indeed the “secret sauce.” When you try to strip away that human interpretation and reduce it to pure mechanical rules (approximating with EMA slope), the edge simply vanishes. This mirrors findings from our other research, like when we tried to mechanize complex discretionary strategies with machine learning meta-labels (Study 33) or by accumulating various heuristics (Study 72). This study, like many others, reinforces a broader conclusion about textbook moving average strategies:
- Long-only trend following tends to be the most resilient approach.
- Strategies based on pullbacks to moving averages or simple MA crosses often fail to show a robust edge when subjected to rigorous forward testing.
For our existing trading systems, this means no changes are needed. The core lesson is invaluable, though: be wary of strategies that heavily rely on subjective interpretation, as that “edge” rarely translates into robust mechanical rules.
This pattern is something we’ve seen consistently across this YouTube series (Studies 82 and 83). Strategies promising to “reliably catch Wave 3” using EMA crosses or Granville’s Law, when mechanized, consistently lack a robust edge. It’s the discretionary, human-interpreted part that holds the “profit,” and that’s precisely the part that’s hardest to automate. Our system for mass-screening these YouTube-inspired strategies based on the
youtube_extract.pyframework is working exactly as intended, helping us quickly identify what works and what doesn’t.
How this connects
This verification builds on earlier ones (what failed before and what I tried this time, comparisons between approaches).