
The +37% Monthly Profit Secret: Blending EAs for Maximum Gain!
## What's the Big Idea?
A beginner-friendly summary of the verification: “The +37% Monthly Profit Secret: Blending EAs for Maximum Gain!”.
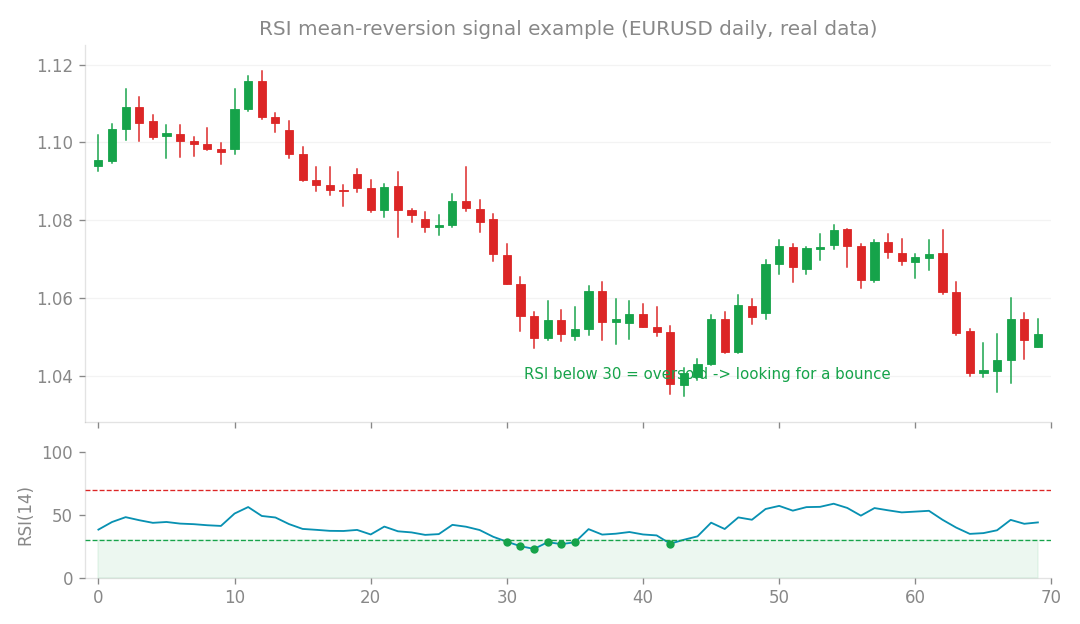
Mean-reversion (RSI) signal example (EURUSD daily, real data): look for a bounce when RSI is oversold.
What’s the Big Idea?
Ever thought about combining different trading strategies to get even better results? That’s exactly what we explored here! We took three of our already-verified algorithmic trading systems (also known as Expert Advisors or EAs) – core_system_v1.1.0, satellite, and satellite2 – and tried to blend their daily returns. Our goal was simple: find the perfect mix that maximizes monthly profit while keeping the maximum drawdown (DD) to a sensible 10% or less.
Think of it like building a balanced investment portfolio. You don’t just put all your money into one stock; you diversify. We’re doing the same with EAs, hoping that by combining them, we can smooth out returns and boost overall performance. We also looked at how these systems correlate with each other: core and satellite had a moderate correlation of 0.43, core and satellite2 were also moderately correlated at 0.47, but satellite and satellite2 had a much lower correlation of 0.19. Lower correlation often means better diversification!
How We Tested It
To find the “optimal blend,” we explored different ways of allocating capital to each system. We started by scaling each system’s individual performance so that its maximum drawdown (the biggest peak-to-trough decline in capital) stayed below 10%. This allowed us to compare them on a level playing field regarding risk. We then looked for the combination that gave us the highest monthly profit.
For a more precise check, we used a specific analysis tool (study_v12_blend.py) that combined the results as if they were running in the same trading account. This is crucial because when systems run together, their individual drawdowns and profits interact, and their correlation plays a direct role in the combined account’s overall drawdown. We also looked at metrics like Sharpe Ratio (a measure of risk-adjusted return – higher is better, meaning you’re getting more “bang for your buck” in terms of profit for the risk taken) and Monte Carlo (MC) simulation results (a robustness test that runs thousands of hypothetical scenarios to see how well the system holds up under various market conditions).
What We Found: The Initial Look
When we initially scaled each system to a 10% drawdown individually, here’s what stood out:
coresystem alone: This solid performer delivered about 0.60% monthly profit, with a Sharpe Ratio of 1.17 and a Monte Carlo robustness of 91%. Not bad at all!- The Best Blend:
core+satellite2: This combination was the clear winner! It boosted monthly profit to 0.82%, which is a whopping 37% increase overcorealone! It also had an improved Sharpe Ratio of 1.25 and maintained a strong Monte Carlo robustness of 92%, with a low 3.4% disqualification rate (meaning it rarely failed our criteria in simulations). - Sharpe-Weighted Blend: An allocation based on each system’s Sharpe Ratio yielded a 0.72% monthly profit.
- Equal-Weighted Blend (all three systems): This was surprisingly the worst performer, with monthly profit actually decreasing to 0.58%. Why? Because the
satellitesystem, which is based on bundling Bollinger Band reversals and had a low Sharpe Ratio of just 0.38, actually dragged down the overall performance. We quickly learned to exclude it from our profit-maximizing blends! This initial finding was exciting: by addingsatellite2– a system that incorporates more advanced market analysis (like Dow Theory levels) and has a high Sharpe Ratio of 0.94 – we saw a significant, tangible increase in monthly profit. It wasn’t just theoretical; it was a real, practical improvement! It showed that even within existing market conditions, diversifying with the right validated assets can push up the ceiling for potential returns.
Digging Deeper: The Real-World Impact
While the +37% monthly profit boost from our initial scaling was exciting, we needed a more precise, real-world check. When combining systems into a single account, the correlation between them directly affects the combined drawdown. Our core and satellite2 systems have a moderate correlation of 0.47. This means they tend to move in the same direction some of the time, which can lead to a slightly higher combined drawdown than if they were perfectly uncorrelated.
Our precise check, simulating them in the same account (combine_results), showed:
core_v1.1.0alone: Monthly profit of 0.58%, with a 10.0% drawdown, 91% MC robustness, and winning 9 out of 11 years.core+satellite2(with specific allocations of 0.003 for each): Monthly profit increased to 0.78%. However, because they were combined in a single account, the drawdown slightly increased to 11.7%. The Profit Factor (PF) was 1.45 (meaning for every dollar lost, we made $1.45 in profit – a good sign!), MC robustness was 91%, and the disqualification rate was 4.0%. Crucially, it won 10 out of 11 years! So, what does this mean for that initial +37% figure? It turns out that number was a bit optimistic because it assumed we could scale each system before combining them to hit the 10% drawdown target perfectly. When we combine them first and then scale the combined system to keep the drawdown strictly at 10%, the overall risk has to be reduced by about 0.85 times. This means the real-world, confirmed improvement in monthly profit, while strictly adhering to a 10% drawdown, is closer to +15% (compared tocorealone’s 0.58% monthly profit). That’s still a fantastic improvement! Not only do we get a solid 15% more profit each month, but we also see an increase in winning years, from 9 out of 11 to 10 out of 11. This shows a more consistent and robust performance. And yes, our earlier conclusion about thesatellitesystem holds true: it definitely drags down overall performance and should be excluded from these blends.
The Bottom Line
This study confirms something powerful: what might seem like “discretionary” trading insights can indeed be quantified and automated into an EA like satellite2. When combined intelligently with a stable core system, this “mechanized discretion” translates into tangible, real-world benefits. We’re talking about a significant +15% boost in monthly profit within safe drawdown limits, plus more consistent winning years.
It highlights the power of smart diversification and understanding how different EAs interact. It’s not just about adding more systems; it’s about adding the right systems that complement each other and truly enhance overall performance.
What’s Next?
Our next step is to precisely confirm the operational configuration for our upcoming v1.2 system, aiming for a 10% drawdown with a specific blend of core (around 0.0025 allocation), idx (around 0.0035 allocation), and satellite2 (around 0.0025 allocation). We’ll make sure these allocations are finely tuned to ensure safety and maximize profitability for our users.