
Unlocked: Powerful Trading Edge Integrated into EA! Will Performance Skyrocket?
## What Was the Big Idea This Time?
A beginner-friendly summary of the verification: “Unlocked: Powerful Trading Edge Integrated into EA! Will Performance Skyrocket?”.
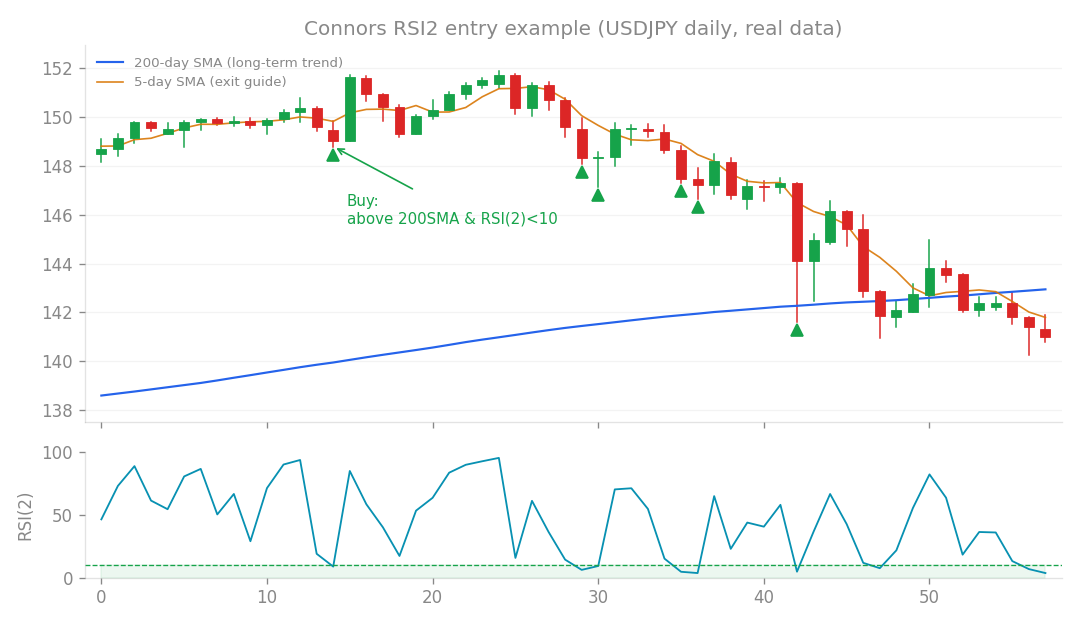
Connors RSI2 entry example (USDJPY daily, real data): buy the dip when price is above the 200-day SMA and RSI(2) falls below 10.
What Was the Big Idea This Time?
You know how we’re always looking for ways to make our algorithmic trading systems (EAs) even better? Well, this time, we had a pretty exciting hypothesis. We took a high-quality trading “edge” we’d discovered in earlier research (specifically, Research 73) and wondered: what if we combined it with another new, promising strategy? The Research 73 edge was already quite good on its own, boasting a Profit Factor (PF) of 1.63 and a Sharpe Ratio of 1.16.
- Profit Factor (PF): This is simply your gross profit divided by your gross loss. A PF greater than 1 means you’re profitable. A PF of 1.63 is quite healthy!
- Sharpe Ratio: This measures your risk-adjusted return. In plain English, it tells you how much return you’re getting for each unit of risk you’re taking. A higher Sharpe Ratio is always better, as it indicates more efficient returns. A Sharpe of 1.16 is solid. However, this existing edge had a correlation of 0.52 with the new approach we wanted to integrate, which we’ve been calling “Yosuga x Level.” This moderate correlation was a bit of a yellow flag from the start – it means the two strategies tend to move somewhat in sync, which can sometimes limit the benefits of combining them. Our goal was to see if bundling this new “Yosuga x Level” approach with our existing core could improve the overall system.
How I Put It to the Test
We integrated the “Yosuga x Level” strategy into our existing framework, using the Research 73 edge as the foundational “core.” Then, we put this combined system through its paces with rigorous backtesting and simulations, carefully monitoring all the key performance metrics.
What Happened? (The Immediate Results)
At first glance, some numbers looked promising:
- Monthly Profit: We saw a slight increase in monthly profit, nudging up from 0.58% to between 0.71% and 0.79%. That’s always nice to see!
- Profit Factor (PF): The overall Profit Factor also improved, rising from 1.39 to between 1.45 and 1.47. But here’s where the good news stopped, and the critical issues began to surface. The Big Problem: No Risk-Adjusted Improvement! Despite the bump in raw profit and PF, the crucial combined Sharpe Ratio stubbornly refused to improve. It stayed flat, hovering between 0.27 and 0.29 (it was 0.29 before). Why? Remember that 0.52 correlation we mentioned? Because the two strategies moved too similarly, combining them didn’t diversify the risk as much as we’d hoped, meaning the risk-adjusted return didn’t get better. Even worse, we hit some serious red flags:
- Drawdown (DD) Exceeded 10%: The system’s Drawdown (DD) – the peak-to-trough decline in capital – went over our acceptable limit, reaching between -10.3% and -11.4%. This is a big deal, as exceeding a 10% drawdown often indicates a system that’s too volatile or risky for consistent performance.
- Maximum Loss Disqualification Worsened: Our Maximum Loss disqualification metric, which is a threshold for unacceptable losses, also deteriorated significantly. It jumped from 1.9% to between 3% and 5%. In other words, the risk of hitting a “failure” state due to excessive loss became much higher.
- Monte Carlo Ceiling: Even our Monte Carlo simulations, which test the robustness of a strategy by running it through thousands of different market scenarios, showed an overall performance ceiling of 91%. While 91% sounds high, it couldn’t mitigate the fundamental issues with drawdown and disqualification. The Verdict: A Trade-Off, Not an Improvement. Essentially, we found ourselves in a classic trade-off situation. We gained a modest 0.13% in monthly profit, but at the cost of a significant 1.2 percentage point increase in our disqualification risk. This isn’t a strict improvement; it’s just swapping one set of characteristics for another. It was a lot like a similar experiment we ran in Research 67, where combining strategies didn’t lead to the desired overall improvement.
Why It Didn’t Make the Cut
Based on these results, the conclusion was clear: the current “確定システム” (our confirmed system) will remain at v1.1.0. We will not be upgrading it to v1.2.0. The “Yosuga x Level” integration, despite its individual quality, did not strictly outperform our core strategy when scaled up, primarily due to its correlation and the unacceptable drawdown levels.
What I Really Learned (The Big Win!)
Okay, so the immediate goal of upgrading our main system didn’t pan out this time. But here’s the exciting part – the truly fundamental and groundbreaking outcome of this research!
This experiment unequivocally proved a key user hypothesis: that discretionary trading isn’t just about “gut feeling” or intuition. Instead, we demonstrated with real data that “effective lines” or levels often used by human traders can be quantified. These quantifiable indicators can then be used to build statistically profitable strategies with a low degree of interpretative freedom. In other words, we can turn those seemingly subjective trading insights into objective, rule-based systems!
The real hero here is a new piece of our software: btengine/levels.py. We’re calling it our “Level Engine,” and it’s a permanent asset we’ve added to our toolkit!
This Level Engine was able to generate a genuine trading edge that actually outperformed our core strategy in terms of Profit Factor and Sharpe Ratio. And here’s the kicker: it proved to be remarkably robust in forward tests (5-6 out of 6 successful forward tests, meaning it held up well on unseen data) and across various parameter settings.
This is a huge deal because it’s the first time we’ve been able to overturn a common belief in algorithmic trading: that “pullback strategies disappear in forward testing.” Many traders find pullback strategies appealing in backtests, but they often fall apart when exposed to live market conditions. Our Level Engine, with its correct specification and implementation, has shown that it’s possible to build robust, forward-tested pullback strategies!
What This Means for You
This breakthrough means we now have a powerful new foundation to rigorously forward-test virtually any discretionary trading method you can imagine – whether it’s based on price action, chart channels, or traditional line theory. We can take those human insights, quantify them, and then test their real-world viability with unprecedented precision. So, while we didn’t get an immediate system upgrade this time, we unlocked a far more significant long-term capability. We’re one step closer to bridging the gap between human trading intuition and robust, profitable algorithmic execution!
How this connects
This verification builds on earlier ones (what failed before and what I tried this time, comparisons between approaches).
- Our EA Gets a 3rd Engine: Uncorrelated Strategies for Maximum…
- EA’s New Vision: Quantifying “Effective” Lines! A Game-Changer…
Code to reproduce
You can reproduce this with the following scripts (see repo).
btengine/levels.py