
Our EA Gets a 3rd Engine: Uncorrelated Strategies for Maximum Stability!
## What's the Big Idea? A Three-Layered Approach
A beginner-friendly summary of the verification: “Our EA Gets a 3rd Engine: Uncorrelated Strategies for Maximum Stability!”.
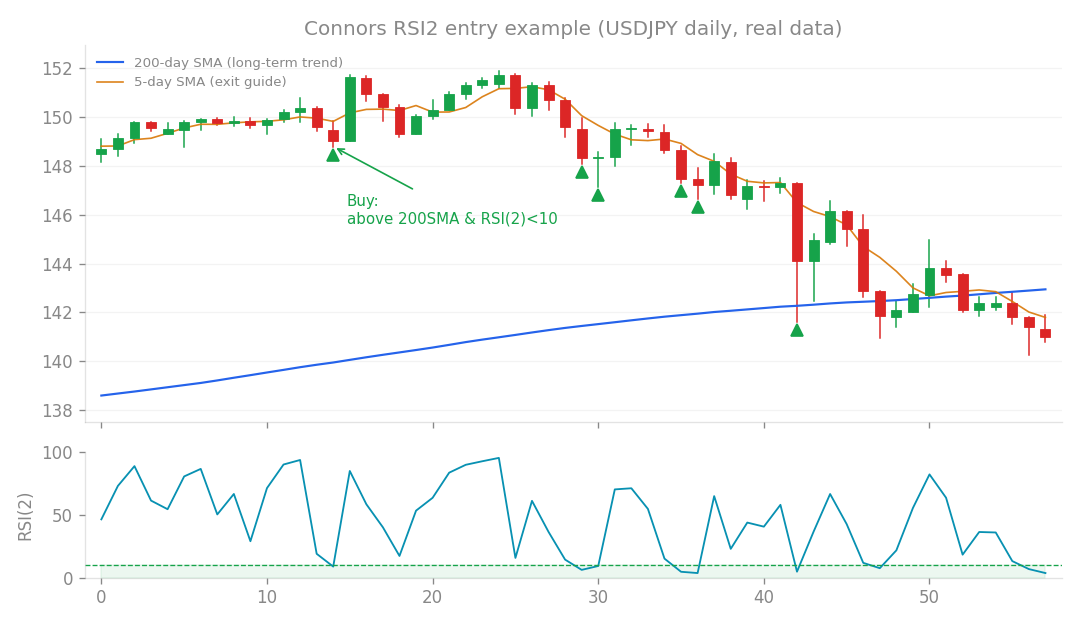
Connors RSI2 entry example (USDJPY daily, real data): buy the dip when price is above the 200-day SMA and RSI(2) falls below 10.
What’s the Big Idea? A Three-Layered Approach
Here in the lab, we’re always looking for ways to make our algorithmic trading systems (EAs) even more robust and profitable. One common strategy is to combine multiple, uncorrelated trading ideas. Think of it like diversifying your investments – you don’t put all your eggs in one basket!
Our current core system is already pretty solid, and we recently layered on an “Exponential sleeve” (from Research 59), which gave it a nice boost. Now, for Research 67, we wanted to see if we could add yet another independent component: the Connors RSI strategy. We’d previously confirmed the Connors RSI (from Research 63) as a genuinely uncorrelated and effective edge, even if a small one (+0.02% to returns). The goal was to bundle these three components – our Core system, the Exponential sleeve, and the Connors RSI – using a method we call combine_results, and then quantify if this “three-layer” approach could further improve our overall monthly return, drawdown (DD), and Monte Carlo (MC) success rate.
A Closer Look at Connors RSI: A Promising Contender
Before we threw Connors RSI into the mix with our existing layers, we first re-evaluated its standalone performance. And wow, did it impress! Running at a conservative risk setting (risk 0.005, meaning a very small percentage of capital risked per trade), the Connors RSI strategy alone:
- Generated a total return of +33% over its test period, averaging 0.21% per month.
- Had a maximum drawdown (DD) of just -7.1%. (Drawdown is the peak-to-trough decline in your capital before a new peak is reached – basically, how much your account might temporarily shrink.)
- Boasted a Profit Factor (PF) of 1.43. (Profit Factor is gross profit divided by gross loss; anything over 1 means profitable, and 1.43 is quite good!).
- Showed an exceptional Sharpe Ratio of 0.94. (The Sharpe Ratio measures risk-adjusted return – how much return you get for the risk you take. A higher number is better, and 0.94 absolutely dwarfs our Core system’s Sharpe of 0.26, indicating very smooth, high-quality returns for the risk involved).
- Achieved a return/DD ratio of 4.6, meaning for every 1% of drawdown, it generated 4.6% in return.
- Was “disqualified” (meaning it failed to meet certain robustness criteria) on only 0.3% of test days. These numbers strongly reaffirmed our earlier findings from Research 63: the Connors RSI strategy is a genuinely high-quality, uncorrelated trading edge on its own. It’s like finding a small but very reliable stream of gold!
The Grand Experiment: Combining All Three Layers
So, with Connors RSI proving its individual strength, the next logical step was to add it to our existing “Core + Exponential” setup. This current two-layer system was already performing well, delivering 0.61% monthly return, with a maximum drawdown (DD) of -10.2%, and an impressive 91% Monte Carlo (MC) success rate. (The Monte Carlo success rate tells us how often our strategy would have remained profitable under thousands of different market simulations – a higher percentage means more robust!) We hoped that adding Connors RSI, with its proven uncorrelated edge, would push these numbers even higher.
What Happened? The Numbers Speak
When we combined Connors RSI with the Core + Exponential system, we saw some interesting, if not entirely what we hoped for, results:
- Return/DD Efficiency Improved, But Marginally: The overall return/drawdown efficiency of the combined system did improve, moving from 12.6 to approximately 14. This is good – it means we’re getting slightly more return for each unit of drawdown.
- Monte Carlo Success Rate Hit a Ceiling: Our MC success rate only nudged up from 91% to 92%. In other words, there was barely any improvement here. Our Core + Exponential system was already so robust that there was very little room for additional improvement in this metric. It’s like trying to fill an already full glass – you can only add a tiny drop more!
- Drawdown Bloated Beyond Our Limit: This was the biggest concern. The maximum drawdown for the combined system expanded to -11% to -12%. This pushed us over our target -10% drawdown limit. Even though Connors RSI is generally uncorrelated, in the worst-case scenarios, its drawdown periods partially overlapped with those of the other two components, leading to a larger overall dip.
- Minimal Monthly Return Boost for the Risk: To get the drawdown back under our -10% limit, we had to reallocate risk across all three components. Once we adjusted for comparable drawdown levels, the actual increase in monthly return from adding Connors RSI was a mere +0.02%. That’s a tiny gain for the complexity added and the initial drawdown expansion.
- Core Robustness Maintained: On a positive note, the Core component continued to maintain its excellent track record, showing 0 days disqualified during daytime M1 trading.
Why Didn’t It Add More? Diminishing Returns!
The conclusion is clear: while Connors RSI is a genuinely high-quality, uncorrelated trading edge, its ability to add significant value to our already strong Core + Exponential system was quite limited. This aligns perfectly with what we’ve seen in previous research (like Research 31 and 32): uncorrelated strategies are real and can provide an edge, but their individual contributions tend to be small, and the benefits diminish significantly after the first one or two layers. It’s like adding ingredients to a delicious stew – the first few make a huge difference, but after a certain point, adding more only provides a marginal improvement, or even starts to negatively impact the balance (like our increased drawdown). We hit a “Monte Carlo ceiling” and ran into our “drawdown limit.”
The Verdict: What We Learned
No changes to our confirmed system for now. The Connors RSI is a fantastic strategy on its own, and it truly offers a high-quality, uncorrelated edge. However, it simply doesn’t provide enough additional benefit to justify integrating it into our primary system at this moment, especially given the increased drawdown and the minimal increase in monthly return after risk allocation. Think of Connors RSI as a “verified third sleeve” that we’ll keep in our toolkit. It’s ready to be inserted if and when our Core system’s drawdown budget opens up in the future – perhaps after we re-evaluate our system composition following the full verification of the Exponential sleeve on M1 data.
What’s Next for Us?
Our biggest priority for maximum added value remains the Exponential sleeve (from Research 59). The main goal is to acquire and fully verify its performance on M1 data. That’s where we expect the next significant leap in performance to come from! We’ll keep you updated on that progress.
How this connects
This verification builds on earlier ones (what failed before and what I tried this time, comparisons between approaches).