
Beyond Our Main Strategy: Hunting for the Elusive "Second Edge
## What's the Big Idea?
A beginner-friendly summary of the verification: “Beyond Our Main Strategy: Hunting for the Elusive “Second Edge”.
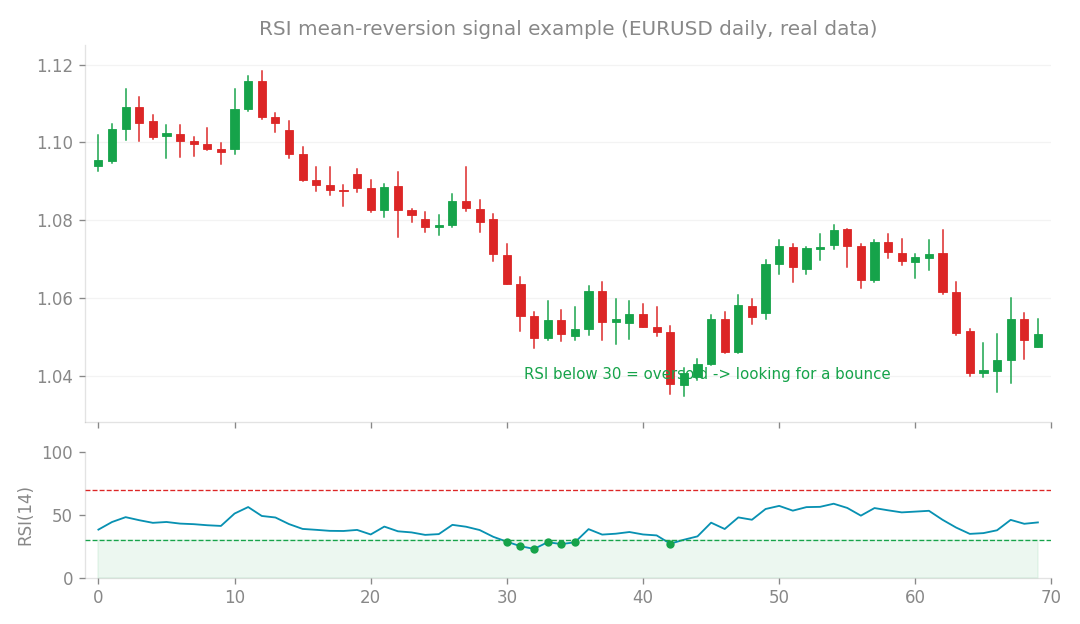
Mean-reversion (RSI) signal example (EURUSD daily, real data): look for a bounce when RSI is oversold.
What’s the Big Idea?
When you’re trading with an Expert Advisor (EA), having one profitable strategy – your “core” edge – is fantastic. But what if you could find a second edge? Something that zigs when your main strategy zags, smoothing out your equity curve and potentially boosting overall returns? That’s what I set out to explore in my latest round of research. The goal was to find a truly independent, price-based strategy that could diversify and strengthen our core long trend-following approach.
The Hunt for New Edges: My Testing Process
Our main EA thrives on long trend-following – essentially riding uptrends in the market. It’s a robust strategy, but even the best EAs have drawdowns. Diversification is key to managing risk, so I investigated three distinct trading ideas, hoping one of them could be that elusive “second edge.” For each candidate, I tested them rigorously using both In-Sample (IS) data (the historical data used for developing or optimizing the strategy) and crucial Out-of-Sample (OOS) data (fresh, unseen data that truly tests if a strategy is robust and not just “overfit” to past market conditions). I also looked at Profit Factor (PF), which is simply gross profit divided by gross loss; a PF greater than 1 means the strategy is profitable. I also considered Drawdown (DD), which measures the peak-to-trough decline in an account, and Expected Value (EV), which tells you the average profit or loss you can expect per trade. Let’s dive into the results!
Candidate 1: Opening Range Breakout (ORB) on M30
What it is: The Opening Range Breakout (ORB) strategy is popular among intraday traders. The idea is to identify the market’s initial trading range (say, the first 30 minutes or an hour after market open) and then place trades when the price breaks decisively above or below that range. I tested this on the M30 (30-minute) timeframe, meaning it’s a relatively high-frequency strategy with many trades. What happened: The results were, frankly, catastrophic.
- Out-of-Sample (OOS): -96%
- In-Sample (IS): -94% In other words, this strategy lost almost all its capital in both the past data and the fresh data. It simply didn’t work. Why it failed: The primary culprit here was spread. Because ORB on the M30 timeframe generates a very high number of trades, the transaction costs (the difference between the buy and sell price) quickly ate up any potential profits. It’s like trying to run a very busy shop with tiny profit margins, but your landlord keeps raising the rent – eventually, you’re just paying to stay open! High-frequency strategies need extremely low spreads to survive, and this one couldn’t hack it.
Candidate 2: Range Counter-Trend with an ADX Filter (USD Pairs, H1)
What it is: This strategy is a “range counter-trend” or mean-reversion approach. Instead of following trends, it tries to profit from prices returning to the average when the market is “ranging” (moving sideways). It targets USD currency pairs on the H1 (1-hour) timeframe and uses an ADX filter. The ADX (Average Directional Index) is an indicator that helps determine the strength of a trend; in this case, the filter would likely only allow trades when the ADX indicates a weak trend, suggesting a ranging market. What happened:
- Out-of-Sample (OOS): -8.9%
- In-Sample (IS): -10.4% (with a Profit Factor of 0.94) Again, we’re looking at negative returns. A PF of 0.94 means for every dollar in profit, the strategy lost roughly $1.06 – a net loss. The “Uncorrelated” Trap: Interestingly, this strategy showed very low correlation with our core long trend-following strategy (-0.07, where 0 means no correlation). This is usually a good thing for diversification, as it means the strategies move independently. When combined with our core strategy, it actually improved the overall drawdown (DD). However, there was a major catch: it had a negative Expected Value (EV). In simple terms, this strategy was a loser on its own. While it reduced overall drawdown by “losing in a different place” than our main strategy, it was still just losing. It’s like trying to diversify your investments by adding a lottery ticket that always loses – it might not move in sync with your stock portfolio, but it’s still just costing you money.
Candidate 3: A Bearish Trend Strategy (H1)
What it is: This was a strategy designed to profit from bearish trends, or short positions, on the H1 (1-hour) timeframe. It aimed to capture downward movements in the market. What happened:
- Out-of-Sample (OOS): +8.0%
- In-Sample (IS): -48.5% This one looked promising at first glance with its positive OOS performance! But the huge discrepancy between OOS and IS is a major red flag. A strategy that performs well on unseen data but horribly on the data it was developed on often indicates a fluke or poor testing methodology. Why it failed: The IS results clearly showed the strategy was “destroyed in rising markets” (uptrends). Since our core strategy is long trend-following (meaning it profits from uptrends), a bearish trend strategy might seem like a natural diversifier. However, if the market spends more time in uptrends or if the strategy simply isn’t robust enough to consistently profit from downtrends, it becomes a net drain. Even though it was uncorrelated with our core strategy, it was still a net loser.
The Hard Truth: No Price-Based Second Edge
The conclusion from this exhaustive research is clear and stark: there is no second price-based edge that works consistently and profitably in FX markets. Candidates B and C, while uncorrelated and offering some theoretical diversification benefits by reducing combined drawdown, ultimately had negative Expected Value. They simply “lost in a different place” rather than providing a true, independent profit stream. This makes them worthless for portfolio diversification. You want strategies that are themselves profitable, not just less correlated ways to lose money! This research strongly reinforces a core belief: the only real, consistent edge in FX prices is long trend-following. Any attempts to find another price-based edge have fallen short. This finding also independently aligns with conclusions from other advanced research streams (often referred to as “fto” in our internal notes). They too have rejected strategies like pullbacks and multi-timeframe (MTF) approaches as true diversification axes, pointing instead to non-price factors like interest rate differentials (the carry trade) as the next frontier for genuine diversification. This is where our future research efforts are now focused.
What Does Work? Maximizing Your Core Edge!
So, if there’s no second price-based edge, what’s the best way to improve our trading? The answer is to maximize the potential of our existing, proven core strategy: long trend-following. We’ve found a highly effective technique called an “Equity Overlay.” Here’s how it works:
- We monitor the EA’s current equity (your account balance).
- If the equity drops below its 60-day Moving Average (a common technical indicator that smooths out price data and shows the average price over the last 60 days), we reduce the lot size by half.
- This significantly decreases drawdown (DD) during rough patches.
- Once the equity recovers and moves back above the 60-day MA, we re-leverage back to the original lot size. Think of it like this: when your star athlete is having an off day, you might bench them for a bit to prevent further injury and let them recover. Once they’re back in form, you put them back in the game at full strength. This equity overlay acts as a dynamic risk management system, protecting your capital when the market isn’t favoring your core strategy, and then letting it run full steam when conditions are good. This approach has shown incredible results. In internal testing (specifically in “fto Chapter E”), this equity overlay technique has demonstrated the ability to double monthly profit while significantly reducing risk. It’s a powerful way to make your existing, winning strategy even better, rather than chasing elusive “second edges” that ultimately lead to losses.