
Ride the FX Wave: Our EA Finds the Strongest & Weakest Currency Pairs
## What's the idea?
A beginner-friendly summary of the verification: “Ride the FX Wave: Our EA Finds the Strongest & Weakest Currency Pairs”.
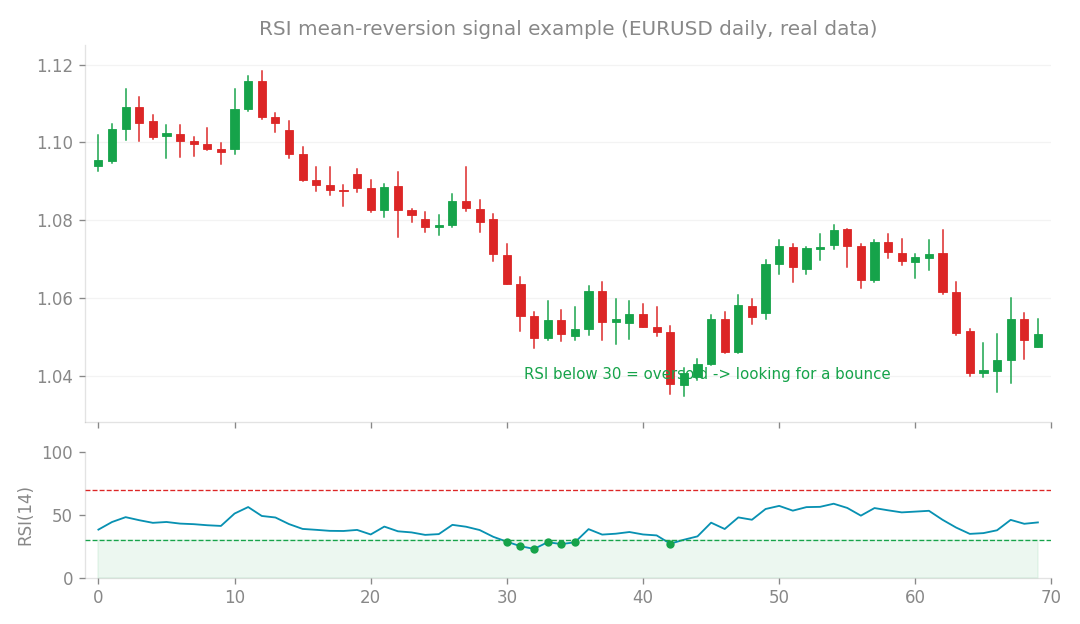
Mean-reversion (RSI) signal example (EURUSD daily, real data): look for a bounce when RSI is oversold.
What’s the idea?
Today we’re diving into a classic trading concept: Relative Strength. In the world of FX, the idea is simple yet powerful: identify currencies that are currently “strong” and buy them, while simultaneously identifying currencies that are “weak” and selling them. It’s a momentum strategy at its core – betting that what’s strong will continue to be strong, and what’s weak will continue to be weak, at least for a while. Think of it like picking the fastest horse in a race and betting against the slowest. We wanted to see if this simple principle could be a profitable foundation for an Expert Advisor (EA).
How I tested it
To put this relative strength idea to the test, we didn’t just eyeball charts. We ran systematic backtests, which means simulating trades over historical data to see how the strategy would have performed. First, we tried a fixed lookback period. This means we picked a specific timeframe (e.g., looking back 100 periods to determine strength) and applied that same timeframe across all the historical data. It’s a good initial check, but it doesn’t really reflect how traders adapt in the real world. That’s why we also used walk-forward optimization. This is a more robust testing method. Imagine you’re driving a car: you don’t just set your GPS once for the whole trip. You constantly update it based on where you are. Walk-forward testing does something similar. We optimize the strategy’s parameters (like that lookback period) on a recent segment of historical data, then test it on the next segment, and then repeat this process over and over. This simulates how an EA might be periodically re-optimized to adapt to changing market conditions, giving us a more realistic picture of its potential performance.
What happened?
Alright, so how did our relative strength momentum strategy fare? Let’s not sugarcoat it: the results were, frankly, quite poor. When we ran the fixed lookback tests across the entire historical data, every single test came back negative. We’re talking losses ranging from -11% to -40%! In other words, if you had traded this strategy with a fixed lookback period, you would have consistently lost money, sometimes a significant amount. That’s a pretty clear “no-go” for a fixed setup. Even with the more sophisticated walk-forward optimization, which we hoped would salvage things by adapting to market shifts, the overall performance was still negative. It came in at a total loss of -8.6%. While certainly not as bad as the fixed lookback results, it’s still a loss, meaning the strategy wasn’t able to consistently generate profit even with adaptive parameter tuning.
What I learned
So, what’s the big takeaway from this experiment? First and foremost, a simple relative strength momentum strategy, at least as implemented in this test, did not prove profitable. Even with walk-forward optimization, it couldn’t turn a profit. But here’s a crucial insight we gained: we observed that JPY pairs (currency pairs involving the Japanese Yen) seem to behave differently. They tend to be more mean-reverting, even in their relative strength. What does “mean-reverting” mean? It’s when prices tend to snap back towards an average or typical level, rather than continuing in a strong trend. Because JPY pairs often exhibit this mean-reverting behavior, momentum strategies like our relative strength approach just don’t seem to work well on them. The “strong” JPY doesn’t necessarily stay strong, and the “weak” JPY doesn’t necessarily stay weak for long enough to profit from. This highlights an important lesson for all EA traders: not all strategies work on all currency pairs. Different pairs have different characteristics and market dynamics. A strategy that might thrive on a trending pair could completely fail on a mean-reverting one. Even when a concept seems solid on paper, the market’s nuances can throw a wrench in the works! So, while this particular attempt didn’t yield profits, it definitely taught us something valuable about market behavior, especially concerning the Japanese Yen.