
Market Adaptation: Can Our EA Switch Strategies for Superior Returns?
We've been exploring various algorithmic trading ideas for FX, and today we're diving into a composite strategy designed to adapt to different market
A beginner-friendly summary of the verification: “Market Adaptation: Can Our EA Switch Strategies for Superior Returns?”.
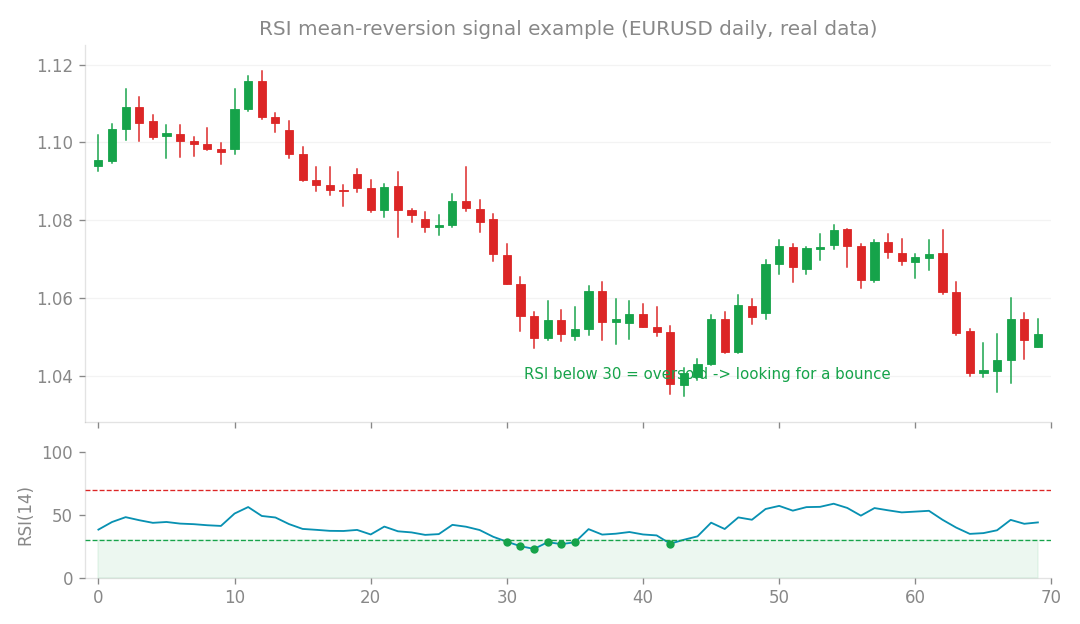
Mean-reversion (RSI) signal example (EURUSD daily, real data): look for a bounce when RSI is oversold.
We’ve been exploring various algorithmic trading ideas for FX, and today we’re diving into a composite strategy designed to adapt to different market conditions. The core idea was to switch between trend-following and mean-reversion strategies depending on whether the market was trending or ranging.
What’s the idea?
Imagine the FX market like a river. Sometimes it’s a fast-flowing current (a trend), and other times it’s a calm, meandering pool (a range). A smart trading robot, or Expert Advisor (EA), should ideally know the difference and adjust its approach. That’s exactly what this strategy aimed to do! We used the ADX (Average Directional Index) indicator as our “switch.” For those unfamiliar, ADX is a popular technical indicator that helps measure the strength of a trend. A high ADX reading suggests a strong trend is in play, while a low ADX indicates a ranging, non-trending market.
- When ADX was high, signaling a strong trend, the EA would employ a trend-following strategy. This is like “going with the flow,” aiming to profit by riding the existing momentum.
- When ADX was low, suggesting a range-bound market, the EA would switch to a mean-reversion (or counter-trend) strategy. This approach tries to “buy low and sell high” within a defined range, betting that prices will eventually revert to their average. The appeal of such a composite strategy is clear: it tries to be versatile, capturing opportunities in both trending and ranging environments.
How I tested it
To give this adaptive strategy a fair shake, I used a rigorous testing method called walk-forward optimization. Unlike simple backtesting, which might just find the best parameters for an entire historical period, walk-forward testing is much closer to simulating real-world trading. Here’s how it works:
- We take a chunk of historical data (e.g., 2 years) and optimize the strategy’s parameters on it. This is our “training” period.
- Then, we take those optimized parameters and test them on the next chunk of data (e.g., 6 months) that the EA has never seen before. This is our “live trading simulation” period.
- We repeat this process over and over, moving forward through history. It’s like training for a series of races by practicing on a different, but similar, track each time, rather than just optimizing for one specific track. I ran these walk-forward tests on two different timeframes:
- D1 (Daily): Where each candlestick represents one full day of trading.
- H4 (4-hour): Where each candlestick represents four hours of trading.
What happened?
Unfortunately, despite the sophisticated approach, the results were quite disappointing.
- On the D1 (Daily) timeframe: The strategy ended with an overall loss of -9.5%. Out of the 7 walk-forward test periods, only 3 were profitable. In other words, over the long run, it lost money, and it was unprofitable more often than it was profitable during our simulated live trading.
- On the H4 (4-hour) timeframe: The performance was even worse, resulting in a staggering -29.4% overall loss. A mere 2 out of the 7 test periods managed to eke out a profit. This means it took a significant hit and consistently underperformed across most of the simulated periods. In short, there was no robust edge to be found. An “edge” is that consistent statistical advantage that makes a strategy profitable over time, and this strategy just didn’t have it.
What I learned
This test reinforced a crucial lesson in algorithmic trading: combining components that don’t have an edge on their own won’t magically create an edge. It’s like trying to build a sturdy house with weak bricks – no matter how cleverly you arrange them, the structure will still be unstable. We’ve now thoroughly explored standard technical analysis approaches, including pure trend-following, pure mean-reversion, and now this adaptive composite strategy. While these concepts are fundamental, relying solely on them with typical indicator setups often falls short in the highly competitive FX market.
Where do we go from here?
This brings us to a critical juncture. If traditional price-based technical indicators aren’t consistently yielding an edge, what’s next? My next, and possibly final, price-based hypothesis to test is Cross-Sectional Momentum, also known as Relative Strength. This is a different beast entirely. Instead of looking at a single currency pair in isolation, it compares the performance of multiple currency pairs against each other. It has some academic backing in the FX market, suggesting a different mechanism at play than what we’ve tested so far. This will be our last major exploration into purely price-based strategies. If Cross-Sectional Momentum doesn’t prove to have a robust edge, it might be time to conclude that the limits of price-only technical analysis have been reached. At that point, we’ll shift our focus to exploring more unique, proprietary hypotheses or incorporating other types of data beyond just price. The journey continues!