
Hidden Dangers: Our EA's True Intraday Risk Finally Revealed!
## What's the big idea?
A beginner-friendly summary of the verification: “Hidden Dangers: Our EA’s True Intraday Risk Finally Revealed!”.
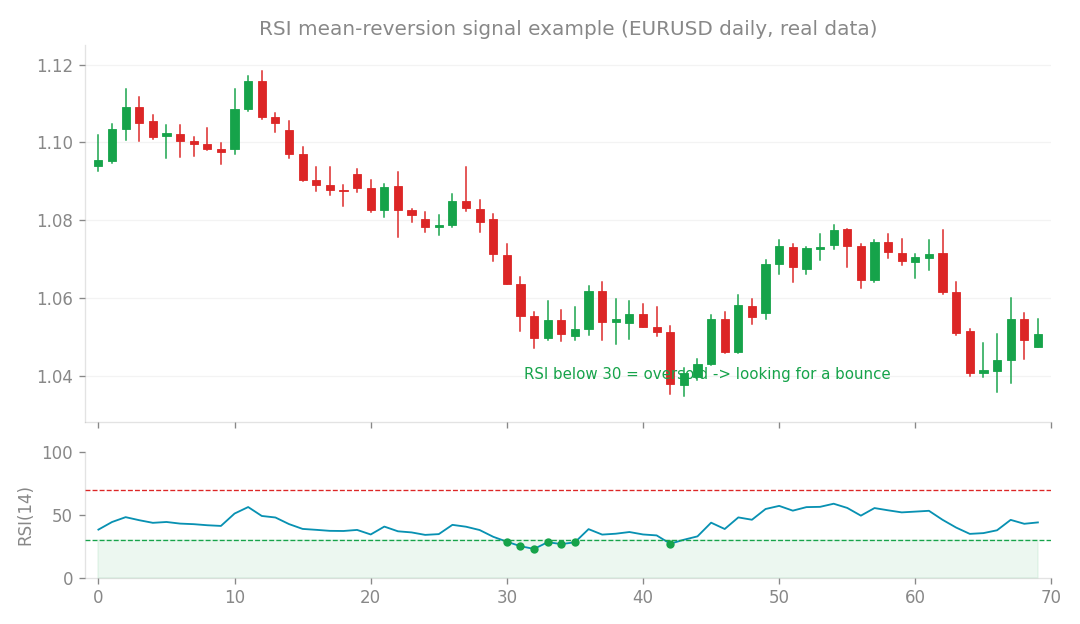
Mean-reversion (RSI) signal example (EURUSD daily, real data): look for a bounce when RSI is oversold.
What’s the big idea?
When we talk about verifying algorithmic FX trading strategies (EAs), especially those designed for longer timeframes like daily (D1), it’s easy to get a false sense of security. A D1 strategy only looks at the market once a day, usually at the close of the daily candle. But what if something wild happens during the day? You could hit your daily loss limit and not even know it until the day is over! That’s why we’ve been working on a new approach. The core idea is to take D1 trades and, while they are open, monitor their profit and loss minute-by-minute (M1). This lets us reconstruct our account equity second-by-second and, crucially, detect if we’ve breached our daily or maximum loss limits intraday. Think of it like putting a high-speed camera on your EA’s performance, rather than just a single snapshot at the end of the day.
How I tested it
For this experiment, we took an existing D1 strategy based on the Relative Strength Index (RSI) – a common indicator for identifying overbought or oversold conditions – specifically on JPY currency pairs. This strategy was designed to be “contrarian,” meaning it tries to trade against the prevailing trend, hoping for a reversal. We ran it on “out-of-sample” (OOS) data, which just means market data the EA hadn’t seen during its development, to get a truly unbiased view. The test setup was simple:
- Open a trade based on the D1 RSI signal.
- While that trade is active, track the floating profit/loss on a minute-by-minute (M1) basis.
- If the intraday loss ever hit a predefined daily loss limit, the strategy would be considered “disqualified” for that day, even if the D1 bar still looked fine at the close. This M1 reconstruction of equity allowed us to see the real-time ups and downs, rather than just the end-of-day picture.
What happened? (A harsh reality check!)
Here’s where it gets really interesting – and a little bit shocking! When we looked at the traditional D1 bar evaluation for this strategy, it proudly declared “worst daily loss: 0.00% - completely unscathed.” Sounds fantastic, right? Like a perfect report card! However, when we applied our new M1 minute-by-minute monitoring, the story changed dramatically. On April 29, 2024, the strategy experienced a -6.32% intraday loss, which would have instantly triggered a daily disqualification! In other words, while the D1 evaluation was telling us everything was fine, our new “honest yardstick” showed that this strategy would have actually been stopped out cold on that particular day.
Why the D1 evaluation missed it
The reason for this discrepancy is fundamental: A D1 bar only represents one data point for the entire day. If your EA opens a trade and experiences a huge drawdown during the day, but then recovers slightly by the market close, the D1 bar might still show a small loss or even a profit. It’s like having a security camera that only takes one picture at midnight – you’d miss all the action that happened earlier! This means the traditional D1 “bar evaluation” fundamentally cannot detect these intraday disqualifications.
The infamous day: April 29, 2024
And why did this particular day hit our strategy so hard? Well, April 29, 2024, was a significant day for USDJPY – it was a day of suspected currency intervention by the Japanese authorities. Our RSI strategy, being contrarian, was trying to fade (trade against) the strong moves initiated by the intervention. It was essentially trying to swim against a tsunami, and it got absolutely clobbered! This makes perfect sense; the strategy was vulnerable to such large, sudden market shifts.
What I learned
This experiment was a huge eye-opener. It highlighted a critical flaw in how we often evaluate D1 strategies.
- Old evaluations were too optimistic: Previously, this strategy showed a “pass rate” of 38% and an Expected Value (EV) of +70,000 units (EV is the average profit or loss you expect per trade, a key metric for profitability). This new test reveals that these numbers were overly optimistic. In reality, this strategy would have suffered an immediate disqualification during this period. It’s like thinking you’re acing a driving test because you didn’t crash at the end, but you actually hit a curb halfway through!
- The “honest yardstick” is essential: This new Method A, which monitors M1 equity during D1 trades, gives us a far more “honest” and realistic measure of a strategy’s performance and risk. It closes a significant blind spot.
- What’s next for us: Our immediate next steps are crucial. We need to go back and update our Monte Carlo simulations (a way to model potential outcomes by running many random scenarios) and, most importantly, update the Expected Value (EV) for this strategy to reflect these intraday disqualifications. Only then will we have a truly trustworthy EV. With this more realistic foundation, we can then move on to exploring more robust and resilient trading “edges” (advantages) using our next methods (B and C). Stay tuned for those updates!